AlgoBullion — Best Free Forex Indicator for MT5: AI Pattern Matching + Smart Money Flow Detector
Ranked among the best free forex indicators for MT5. A 45-buffer institutional-grade detector with k-NN pattern similarity engine, BOS/MSS/FVG smart money features, 5-regime market classification, adaptive sensitivity with self-learning weights, and a real-time dashboard. Free compiled ex5 download — no registration required.
Free Download — AlgoBullion v3.00
Compiled EX5 file. Works on any MetaTrader 5 platform. Licensed until 2030.
Source code available upon request — contact us for licensing.
File size: ~120 KB | Platform: MetaTrader 5 | License valid until Jan 1, 2030
How AlgoBullion Looks on Chart
AlgoBullion renders a colored EMA line on the price chart with a 4-layer confidence cloud, plus match boxes showing the top historical periods that are most similar to current market conditions. A floating dashboard panel shows real-time metrics.
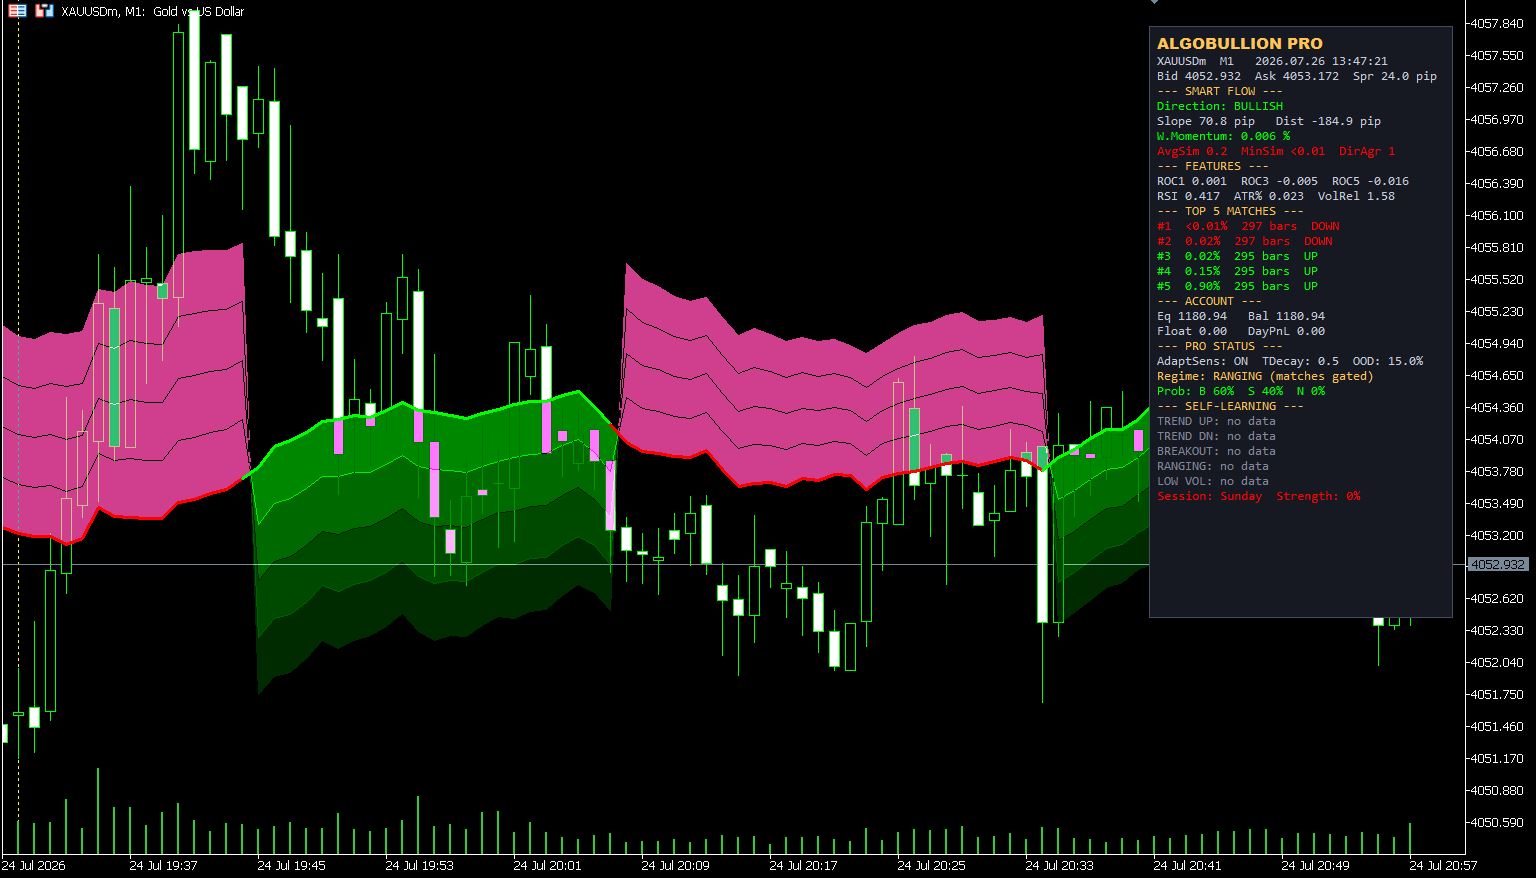
AlgoBullion on an MT5 chart. The colored EMA line changes between green (bullish), red (bearish), and blue (neutral). Match boxes in the background show the most similar historical patterns with similarity percentage and directional labels.
Table of Contents
- What Is AlgoBullion?
- The 7 Detection Engines
- The 12-Dimensional Feature Vector
- How Pattern Matching Works — k-NN with Mahalanobis Distance
- Dashboard Panel Explained
- Input Parameters — Full Reference
- How to Read AlgoBullion Signals
- Alerts & Notifications
- Self-Learning: Adaptive Weights & Win Rate Tracking
- Installation Guide
- FAQ
1. What Is AlgoBullion?
AlgoBullion is an institutional-grade MT5 indicator built for traders who want more than just another moving average crossover. It combines a k-NN pattern similarity engine that scans up to 2,000 historical bars to find the closest matches to current market structure, with smart money detection (BOS, MSS, FVG, liquidity sweeps), 5-regime market classification, and a self-learning system that adapts its sensitivity and feature weights based on real-time outcome tracking.
The output is simple — a colored EMA line (green = bullish, red = bearish, blue = neutral) with a 4-layer confidence cloud. Match boxes show you exactly which historical periods the current market most resembles, with similarity percentages and directional labels. A docked dashboard panel gives you 37 rows of real-time analytics including probability distribution, win rates per regime, session strength, and the 12-dimensional feature breakdown.
| Specification | Value |
|---|---|
| Name | AlgoBullion |
| Version | 3.00 |
| Platform | MetaTrader 5 (MT5) |
| Buffers | 45 (24 calculation + 21 smart money/probability/learning) |
| Plots | 5 (4-layer cloud + 1 colored EMA line) |
| Core Algorithm | k-NN with Mahalanobis-style standardized distance (12D feature space) |
| Scan Depth | 20–2,000 bars (auto-scaled by timeframe, up to 3x on H4+) |
| Smart Money Features | BOS, MSS, FVG, Equal Highs/Lows (liquidity), Displacement, Trend Direction |
| Regimes | 5 (Trending Up, Trending Down, Breakout, Ranging, Low Vol) |
| License | Free until January 1, 2030 |
2. The 7 Detection Engines
AlgoBullion is not a single-indicator system. It runs 7 concurrent detection engines, each feeding into the final probability-weighted output.
| # | Engine | What It Does | Output |
|---|---|---|---|
| 1 | Pattern Similarity | Scans historical bars and finds top-K most similar patterns to current market via standardized 12D distance. Temporal decay weights recent patterns higher. | Top-5 match similarity %, weighted momentum, match boxes on chart |
| 2 | Smart Money (BOS/MSS) | Detects Break of Structure and Market Structure Shift using 5-bar fractal swing point analysis. Tracks when highs/lows break previous structural points. | BOS and MSS signals per bar (-1 to +1 scale) |
| 3 | FVG Detection | 3-candle imbalance detection. Measures gap between candle wicks against ATR to identify fair value gaps — the empty space where price has not been traded. | FVG signal (+1 bullish, -1 bearish) when gap exceeds 30% ATR |
| 4 | Liquidity Sweep | Scans 10-bar window for clustered equal highs and lows. When price breaks through a cluster, it flags the liquidity sweep — trapped traders with stops beyond. | Buy-side and sell-side liquidity sweep flags per bar |
| 5 | Regime Classification | Classifies each bar into 1 of 5 market regimes using ATR ratio, ROC5 magnitude, and RSI value. ATR expansion > 1.8x = Breakout. ATR < 0.4x = Low Vol. Between = Trend or Range. | Integer regime label (0-4) plus gated pattern matching (only matches from same regime) |
| 6 | Adaptive Sensitivity | Automatically adjusts similarity sensitivity based on current volume relative to its moving average. High volume → higher sensitivity. Low volume → relaxed thresholds. | Dynamic sensitivity value that protects against false matches in low-liquidity sessions |
| 7 | Self-Learning | Tracks per-regime win rates over time using MT5 GlobalVariables. Updates adaptive feature weights — rewarding features that contributed to correct predictions and penalizing noise features. | Running win rate % per regime, learned feature weights stored persistently |
3. The 12-Dimensional Feature Vector
Every bar in AlgoBullion is described by a 12-dimensional feature vector. This is what makes the pattern matching statistically meaningful — it's not comparing just one indicator value. It's comparing momentum across three time horizons, volatility, volume, market structure, displacement, and institutional flow signatures all at once.
| # | Feature | What It Measures | Default Weight |
|---|---|---|---|
| F1 | ROC 1-bar (%) | Immediate price change — short-term momentum | 1.0 |
| F2 | ROC 3-bar (%) | 3-period momentum — filters noise from F1 | 1.0 |
| F3 | ROC 5-bar (%) | Swine-level momentum — determines direction of top-K matches | 1.2 |
| F4 | RSI (norm 0–1) | Overbought/oversold state — contextualizes momentum | 1.5 |
| F5 | ATR % of price | Volatility relative to price — identifies calm vs explosive conditions | 1.0 |
| F6 | Volume Relative | Tick volume vs 20-bar MA — unusual activity detection | 0.8 |
| F7 | Displacement | Body/range ratio — measures directional conviction (0–1) | 1.0 |
| F8 | Trend Direction | EMA slope normalized to -1..+1 — regime-agnostic trend signal | 1.3 |
| F9 | BOS Signal | Break of Structure — fractal pattern acknowledges institutional flow | 1.2 |
| F10 | MSS Signal | Market Structure Shift — directional change in structure | 1.2 |
| F11 | FVG Presence | Fair Value Gap — imbalance indicating institutional interest | 1.0 |
| F12 | Liquidity Cluster | Combined buy-side + sell-side liquidity sweep signal per bar | 1.0 |
Features F1–F6 capture what most indicators track (price + volume + volatility). Features F7–F12 capture what institutional traders track (displacement, structure, imbalance, and where trapped orders sit). The combination is what separates AlgoBullion from single-indicator systems.
4. How Pattern Matching Works — k-NN with Mahalanobis Distance
The Layman Explanation
Imagine you're looking at today's market and asking: "When has the market looked exactly like this before?" AlgoBullion answers that question mathematically. It takes the current bar's 12-dimensional fingerprint (momentum, volatility, volume, structure, etc.) and scans the last 300-2,000 historical bars looking for the 5 most similar fingerprints. It then checks what happened after those similar periods — did price go up or down? — and uses that to compute a weighted probability for the current bar.
The Technical Explanation
AlgoBullion uses a Mahalanobis-style standardized distance over the 12D feature space. Each feature is normalized by its historical standard deviation so that a 1% change in ROC5 (which might be normal) is penalized differently than a 10% change in ATR % (which would be extreme). The distance formula is:
distance = sum( |current_feature[j] - historical_feature[j]| / std[j] * weight[j] ) over j=0..11
This distance is then converted to a similarity score using an exponential decay function: similarity = 100 * exp(-distance * sensitivity). The sensitivity parameter controls how strictly the engine penalizes small differences — lower values give more matches (good for ranging markets), higher values only match nearly identical conditions (good for clean trends).
Key Selection Optimizations
- Heap-based Top-K: O(N log K) complexity instead of O(N^2) — 2,000 bars scanned in milliseconds.
- Regime Gating: Matches are only pulled from bars in the same market regime (Trending Up/Down, Breakout, Ranging, Low Vol). You don't match a trending bar to a consolidation bar — that would produce false signals.
- Two-Pass Fallback: If pass 1 (strict regime gate) produces fewer than 3 matches, pass 2 widens to any regime to ensure the dashboard always has data.
- Temporal Decay: Older historical matches are penalized by an exponential decay factor. A match from 10 bars ago carries more weight than one from 500 bars ago.
- SMA-Seeded EMA: The resulting weighted momentum line is smoothed with an EMA that is seeded using an SMA of the first N values — eliminating the cold-start bias that plagues standard EMAs.
5. Dashboard Panel Explained
The right-side dashboard panel shows 37 rows of real-time data updated every second via the OnTimer event. It is fully draggable — click and drag the dark panel to reposition it anywhere on your chart.
| Dashboard Section | Rows | Key Metrics |
|---|---|---|
| TITLE | 1 | "ALGOBULLION PRO" header |
| SYMBOL INFO | 2 | Symbol + timeframe + time, Bid/Ask/Spread |
| SMART FLOW | 3 | Direction (Bullish/Bearish/Neutral), Slope, Distance from line, Weighted Momentum, AvgSim, MinSim (OOD flag), DirAgreement |
| FEATURES | 2 | ROC1, ROC3, ROC5, RSI, ATR%, VolRel live values per bar |
| TOP MATCHES | 5 | Match #1-5 with similarity %, bars ago, and direction (UP/DOWN/FLAT) |
| ACCOUNT | 2 | Equity, Balance, Floating P&L, Daily P&L (closed + floating) |
| PRO STATUS | 3 | AdaptSens ON/OFF, Temporal Decay, OOD threshold, current Regime, Probability Bull/Bear/Neutral % |
| SELF-LEARNING | 5 | Per-regime win rates: Trend Up, Trend Down, Breakout, Ranging, Low Vol with color-coded % |
| SESSION | 1 | Active sessions (Asia/London/NY) + session strength % |
6. Input Parameters — Full Reference
AlgoBullion exposes 40+ customizable input parameters grouped into 10 logical sections. Below is the parameters dialog showing every option you can configure.
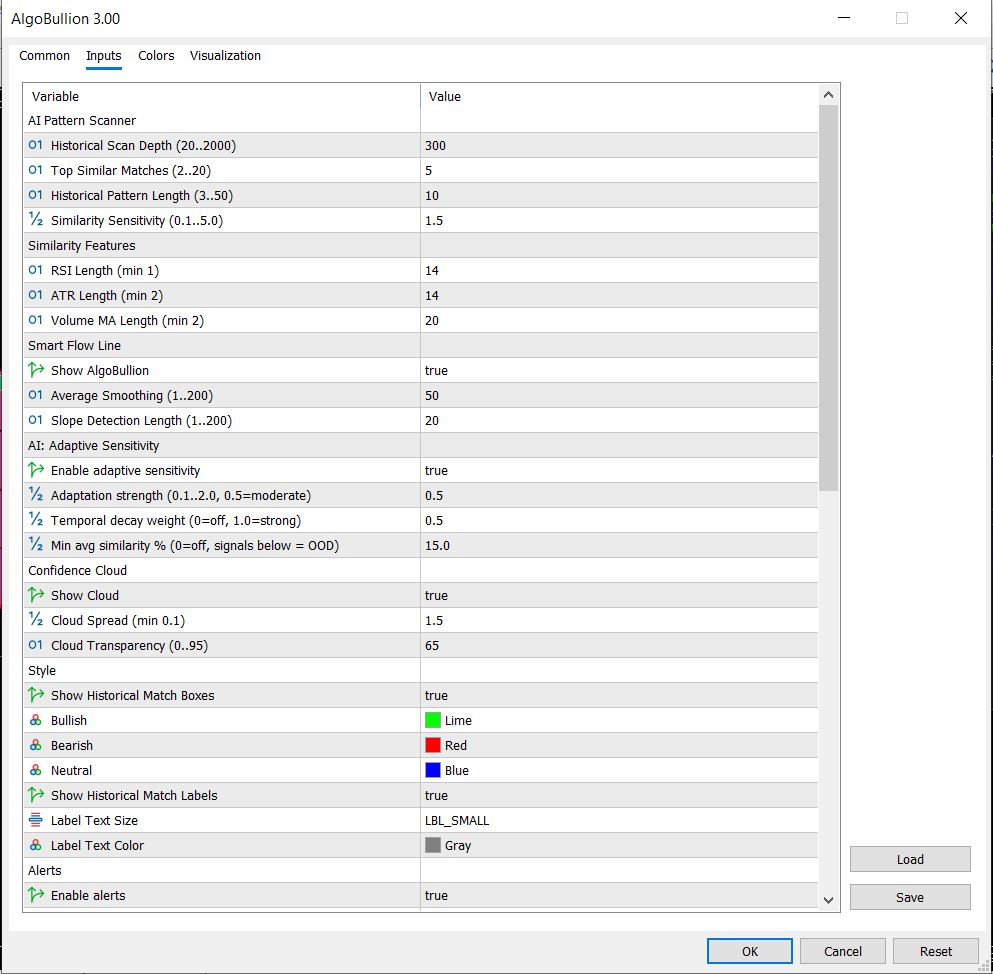
| Group | Parameter | Default | Range / Description |
|---|---|---|---|
| AI Pattern Scanner | Scan Depth | 300 | 20–2000 bars, auto-scaled by timeframe |
| Top Matches | 5 | 2–20 most similar patterns to display | |
| Pattern Length | 10 | 3–50 bars per pattern slice | |
| Sensitivity | 1.5 | 0.1–5.0 (lower = more matches, higher = stricter) | |
| Similarity Features | RSI Length | 14 | Standard RSI period |
| ATR Length | 14 | ATR period for volatility normalization | |
| Volume MA Length | 20 | Tick volume moving average period | |
| Smart Flow Line | Show Line | ON | Enable/disable the colored EMA line |
| Smoothing | 50 | EMA period for line smoothing (1–200) | |
| Trend Length | 20 | Slope detection period (1–200) | |
| AI: Adaptive Sens | Enable | ON | Volume-based dynamic sensitivity adjustment |
| Strength | 0.5 | 0.1–2.0 adaptation strength | |
| Temporal Decay | 0.5 | 0=off, 1.0=strong — recent patterns weighted higher | |
| Min OOD Threshold | 15.0% | Similarity below this = Out-of-Distribution warning (red) | |
| Confidence Cloud | Show Cloud | ON | Enable/disable the 4-layer gradient cloud |
| Cloud Spread | 1.5 | ATR multiplier for cloud width | |
| Transparency | 65 | 0–95 cloud opacity | |
| Alerts | 14 params | — | Cross, color change, popup, push, sound alerts |
| Dashboard | 4 params | — | Show/hide, X/Y position, font size |
| Session Filter | 4 params | — | GMT-based session filtering, Friday cutoff |
| News Filter | 9 params | — | MT5 economic calendar integration, visual lines, block windows |
7. How to Read AlgoBullion Signals
| Signal | Appearance | Meaning | Trading Context |
|---|---|---|---|
| Green Line + Cloud | EMA line colored green, cloud gradient green | Weighted momentum from top-K matches is positive. Slope of smoothed line is rising. | Historical similar patterns are predominantly bullish. Consider long entries at support. |
| Red Line + Cloud | EMA line colored red, cloud gradient red | Weighted momentum is negative. Slope is declining. | Historical similar patterns are predominantly bearish. Consider short entries at resistance. |
| Blue Line | EMA line colored blue, no cloud gradient | Slope is flat/no clear signal. Top-K matches show mixed directions. | Consolidation/indecision. Do not enter. Wait for color change. |
| Line Crossover | Price crosses above/below the AlgoBullion smoothed line | Real-time momentum exceeds (or falls below) the historical weighted average | Stronger confirmation when crossing in the same direction as the line color |
| OOD Warning | MinSim in dashboard shows red with low % | Top matches have low similarity — current market has no historical precedent | Out-of-distribution event. Do not trade. Wait for similarity to recover. |
8. Alerts & Notifications
AlgoBullion supports 8 independent alert triggers, each configurable independently with popup (Alert), mobile push notification, and sound output.
| Alert | Triggers When |
|---|---|
| Price Crossed Above | Bid crosses above AlgoBullion smoothed line |
| Price Crossed Below | Bid crosses below AlgoBullion smoothed line |
| Changed Bullish | Slope turned positive (line changed from red/blue to green) |
| Changed Bearish | Slope turned negative (line changed from green/blue to red) |
| Changed Neutral | Slope flattened to zero (line changed to blue) |
| Any Cross | Either cross-up or cross-down event |
| Any Color Change | Any of the three color-change events |
| Any Alert | Union of all trigger types — catch-all notification |
9. Self-Learning: Adaptive Weights & Win Rate Tracking
AlgoBullion contains a persistent learning system that stores running statistics across MT5 sessions using GlobalVariables. This means the indicator gets smarter the longer you use it on a specific symbol.
- Per-Regime Win Rates: For each of the 5 market regimes (Trend Up/Down, Breakout, Ranging, Low Vol), the engine tracks total predictions and correct predictions. A correct prediction is one where the weighted momentum direction matches the actual price movement X bars forward.
- Adaptive Feature Weights: Each of the 12 features starts with a default weight (see Section 3 table). After each prediction, the engine checks if the prediction was correct. If yes — features that were closely matched get their weights increased. If no — features with large discrepancies get penalized. The learning rate is 0.05, so weights adapt gradually over hundreds of bars.
- Per-Symbol Persistence: All learning data is keyed by symbol + regime. EURUSD Trend Up has its own weights and win rate. XAUUSD Breakout has its own. GBPUSD Ranging has its own. This prevents cross-symbol contamination.
- Dashboard Transparency: All 5 regime win rates are displayed in real-time on the dashboard (green if above 60%, blue if 45-60%, red if below 45%, dim if no data). You can see which market conditions AlgoBullion performs best in — and avoid the ones where it struggles.
10. Installation Guide
- Download
AlgoBullion.ex5from the download button at the top of this page. - Copy the file to:
MQL5\Indicators\(Open MT5 → File → Open Data Folder → MQL5 → Indicators). - Restart MT5 or right-click the Navigator panel and click Refresh.
- Find AlgoBullion under Navigator → Indicators.
- Drag it onto any chart (works on all instruments: XAUUSD, EURUSD, GBPUSD, US30, NASDAQ, etc.).
- For alerts to work, enable push notifications in MT5: Tools → Options → Notifications → Enable Push Notifications → enter your MetaQuotes ID.
- For news filter to work, the economic calendar must be available in your MT5 terminal (Tools → Calendar → enable).
The indicator is valid on all timeframes. The scan depth auto-scales: H1 uses 300 bars × 2 = 600. H4 uses 300 bars × 3 = 900. Higher timeframes get proportionally deeper scans.
11. FAQ
Is AlgoBullion really free?
Yes — the compiled EX5 is free. The license is valid until January 1, 2030. Source code is available on request for custom modifications. Contact us for source code licensing.
Can this indicator repaint?
No. AlgoBullion calculates on closed bars only. The EMA line uses an SMA-seeded initialization but once the EMA seed is established (after the first smoothing period), all calculations use confirmed close prices.
What timeframes work best?
H1 and M15 are the sweet spot — enough bars per session for clean patterns without excessive noise. M5 works for scalping but produces more false signals due to micro-range noise. H4 and Daily work well for swing bias confirmation.
What instruments does this work on?
All MT5 instruments — forex pairs, XAUUSD, XAGUSD, indices (US30, NAS100, GER40), commodities (USOIL), and cryptocurrencies. The pattern engine is instrument-agnostic because all 12 features are normalized.
How many bars of history do I need?
At least 350 bars for the default scan depth to work properly. More is better — 500+ bars produce more reliable top-K matches. For M5, load at least 1,000 bars.
Can I use this for automated trading?
The EX5 is an indicator only — it does not place trades. However, the buffer values (BufLine, BufLineColor, BufProbBull, BufProbBear, BufRegime) are accessible from other EAs using iCustom(). You can build an EA that reads these buffers and trades based on the signals. We build custom EAs that integrate AlgoBullion signals.
Want the AlgoBullion Source Code or a Custom EA?
The EX5 is free. Source code access, custom modifications, white-label rebranding, and fully automated EAs built around AlgoBullion signals are available. View our pricing or see how our process works.
Request a Quote