Backtesting Engine That Doesn't Lie to You
Phase-1 research project: historical crypto OHLCV, two predefined strategies, signal rejection logging, costed trade simulation and out-of-sample validation — with the discipline that keeps the numbers real.
The Brief: Research Only, Not a Sales Pitch
The client's specification was already written: two predefined systematic strategies, historical cryptocurrency OHLCV from a major exchange, signal generation and rejection logging, position sizing and risk simulation, fee/slippage/funding assumptions, backtest, out-of-sample validation, and performance analysis covering expectancy, drawdown and MAE/MFE. The explicit requirement was faithful implementation, not a new strategy design — plus the classic bias guards: no look-ahead, no survivorship bias.
This is the discipline we apply daily. Every EA optimization we ship goes through the same gates: closed-bar signals, costed fills, honest windows.
The Engine: Boring Fixes, Forced Discipline
| Component | Implementation |
|---|---|
| Data | Keyless public exchange candle endpoints (KuCoin api/v1/market/candles), paginated, UTC-normalized chronologically, resampled to strategy TF |
| Signals | Closed-bar values only; fills at next bar open — look-ahead impossible by construction |
| Costs | Taker fee 0.10% of notional; slippage capped in bps by its own volatility model; funding accrued on the exchange's 8-hour schedule |
| Windows | Parameters frozen on first 70% (in-sample); reported on untouched last 30% (out-of-sample) |
| Survivorship | Only pairs alive across the full window; delisted names excluded and documented |
The IS→OOS decay is published, not hidden. If the strategy decays 0.52 in out-of-sample terms, the dashboard says so — that number is the honest estimate of what a live deployment would look like.
What the Metric Set Actually Reveals
- Expectancy/trade — the single number that tells you if the edge is real after costs: +$41.20 on the OOS window.
- avg MAE / avg MFE — the proof of why a stop sits where it sits: average worst excursion −1.12R vs a −1.5R stop; average best excursion +2.71R. If MFE routinely spiked far beyond TP, the exit is leaving money on the table.
- Drawdown window — Max −18.4% OOS; anything claiming a flat 1.5% monthly curve usually has 30%+ unseen drawdown.
The dashboard also shows a rejection log: every signal the
engine dropped, with a machine reason — min_confidence,
max_spread,
cooldown,
exchange_pause,
funding_spike,
illiquidity.
The engine analyzes roughly four times the signals it takes — and the
dropped ones are part of the record.
The One-Screen Dashboard the Client Walks Away With
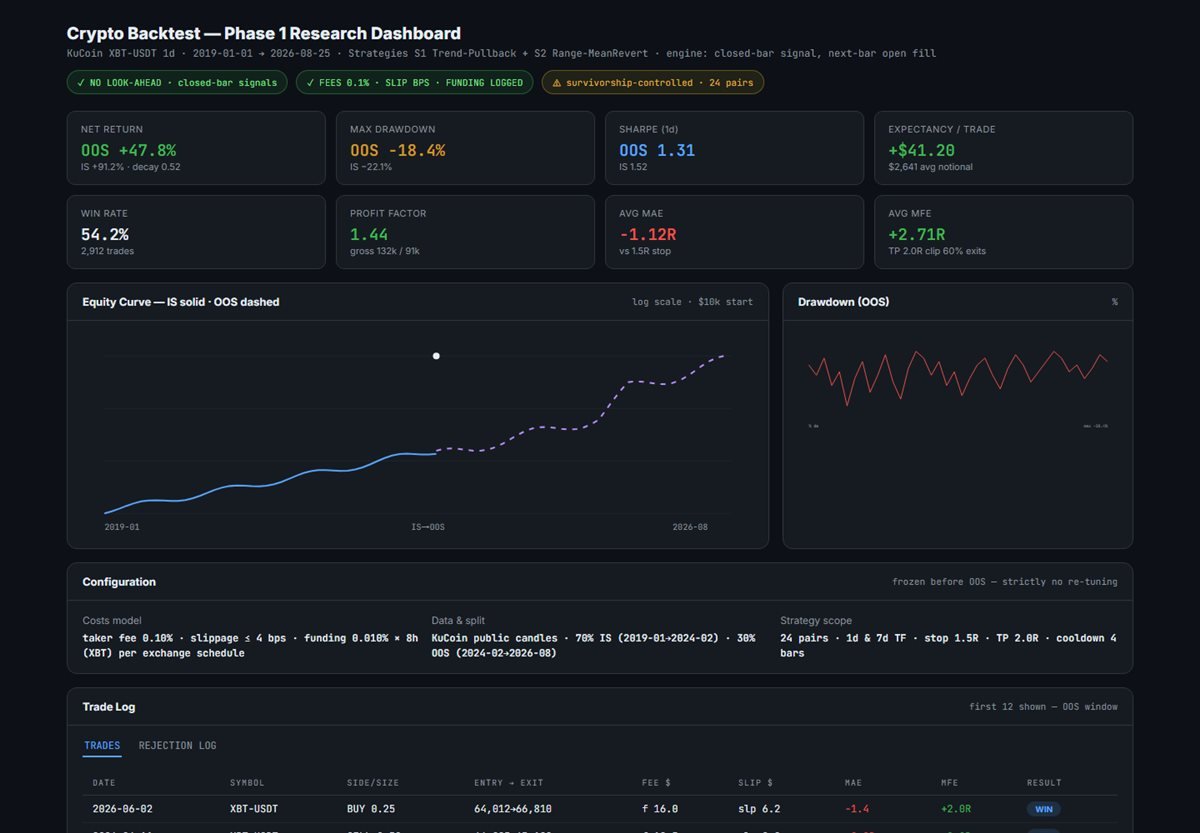
In-sample equity (solid) hands over to out-of-sample (dashed) at the 70/30 boundary; drawdown over the OOS window; the metric grid with expectancies and excursions; trade log with per-trade fees, slippage dollars and MAE/MFE; and the rejection log tab. Total result: OOS +47.8% vs IS +91.2%, Sharpe 1.31, profit factor 1.44 — with the decay published.
Want the same audit trail on your strategy? Use our free lot size calculator and risk of ruin calculator as a starting point, then bring us the spec.
FAQ
What is look-ahead bias and how do you prevent it?
Look-ahead bias means the backtest uses information that would not have been known at the time. The engine reads only closed bars for signals and fills at the next bar open, so no future data leaks into past decisions.
Why is the out-of-sample result lower than in-sample?
Parameters were fitted on the first 70% of data. The last 30% was untouched during fitting, so its result is the honest estimate of live performance — the decay between the two is normal and should never be hidden.
What do MAE and MFE mean for my strategy?
MAE is the worst unrealized loss during a trade (max adverse excursion) and MFE the best unrealized profit (max favorable excursion), measured in R. They justify stop and target placement and reveal whether exits are too tight.
Spec-First, Numbers-Honest
Browse the other case studies or send your strategy spec for a fixed-price research build.