MT5 Bank Orders Institutional Flow Dashboard
This dashboard is built to turn ICT and smart-money structure into a readable multi-symbol workflow: zones, liquidity, BOS/CHoCH, FVG, premium/discount and confirmed trade context.
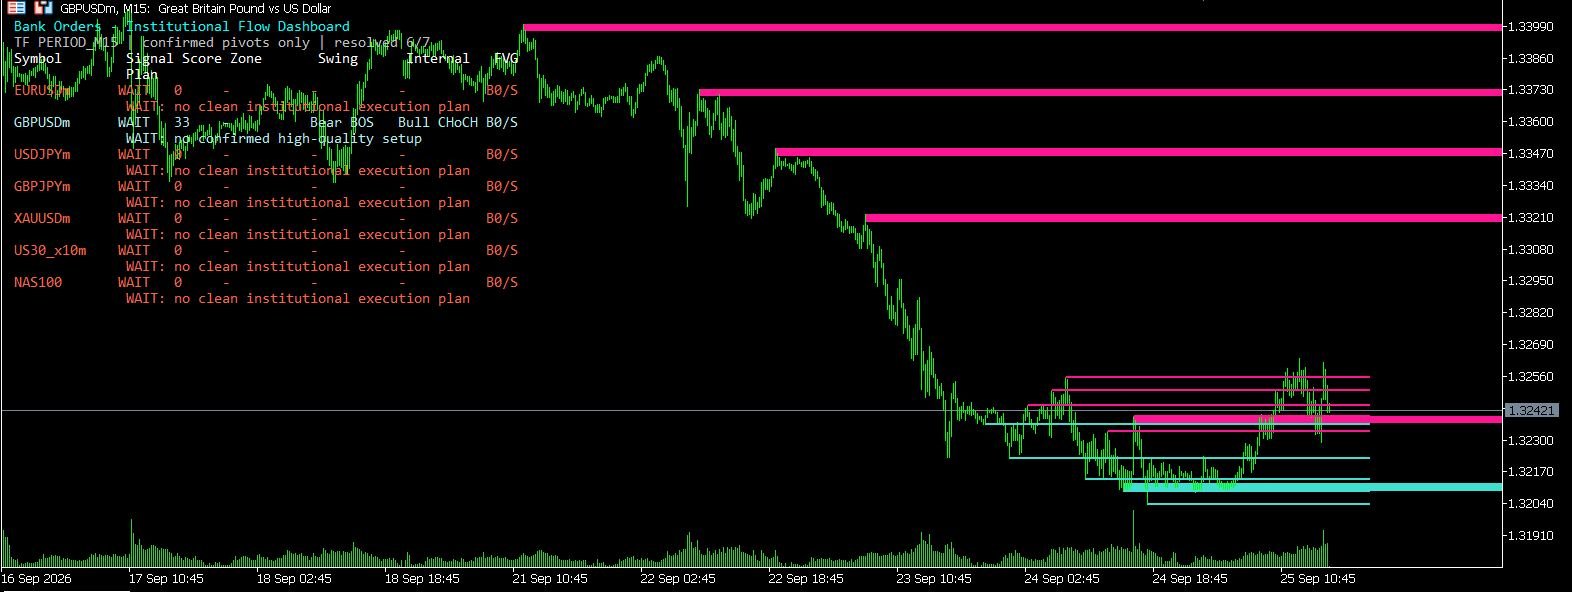
What the Dashboard Tracks
The indicator scans a symbol list and resolves broker suffixes automatically. It uses a working timeframe, copies market rates, builds supply/demand zones, maps liquidity levels, detects internal and swing structure, counts equal highs/lows, finds fair value gaps and then converts the context into a dashboard state.
Uses swing and ATR context to draw relevant institutional areas instead of cluttering the chart with every candle.
Tracks break-of-structure and change-of-character style context for trend and reversal interpretation.
Highlights fair value gaps, equal highs/lows and liquidity levels that may act as price magnets or reaction zones.
Locks a qualified setup for a limited number of bars so the dashboard does not flicker on every small recalculation.
Limited Source Snapshot
input bool InpShowSwingStructure     = true;
input bool InpShowInternalStructure  = true;
input bool InpShowEqualHighsLows     = true;
input bool InpShowFVG                = true;
input bool InpUseConfirmedSignalLock = true;

void BuildSupplyDemand(...);
void BuildSMC(...);
void BuildTradeSignal(...);
Why This Matters for Traders
Many traders learn ICT terms from videos but struggle to turn them into a repeatable checklist. This dashboard forces the market into categories: wait, bullish context, bearish context, zone, swing, trade plan and risk state. That makes it easier to avoid emotional entries when the market has no clean institutional execution plan.
