MT5 D1/H1 15-Pip Pending Signal Indicator
This indicator compares the current D1 and H1 state against historical cases, then tests pending-order styles to find whether Buy Limit, Sell Limit, Buy Stop or Sell Stop has the strongest data-backed plan.
What Makes It Different
Instead of printing a market buy or sell, the engine evaluates pending-order alternatives. It scans H1 and D1 history, builds nearest cases, simulates whether an order would have filled, then checks if TP or SL would have been reached first inside the configured test window.
Buy Stop, Sell Stop, Buy Limit and Sell Limit are compared separately.
Daily regime, previous day behavior, H1 momentum, session and range position are part of the match.
Separates “would this trade win” from “would this pending order even trigger.”
Ranks plans by win rate, profit factor, expectancy, score and recent sample behavior.
Deep Technical Architecture
The unique idea behind this indicator is that direction alone is not enough. A trader may be right about direction and still choose a poor entry type. This engine evaluates the current D1 regime and H1 micro-context, then tests multiple pending-order scenarios against historical cases that look similar to the current market.
Reads previous daily candle direction, daily range, daily ATR, current-day progress, previous-day close position and the location of price inside the broader daily structure.
Uses H1 momentum, candle rejection, body/range quality, sequence behavior, session timing, liquidity sweep clues and range rank.
Searches old H1 situations that share similar hour, weekday, daily state, momentum and volatility profile instead of testing random candles.
For each matched case, it tests whether a Buy Stop, Sell Stop, Buy Limit or Sell Limit would trigger, then whether TP or SL was reached first.
Why It Is Stronger Than a Normal Pending Order Indicator
Most pending-order indicators simply place lines above or below price. Some use a fixed breakout distance, some use ATR, and some use support/resistance. This one goes deeper by comparing several live trade designs and showing the statistical weakness of each rejected plan.
- Four alternatives are tested: Buy Stop, Sell Stop, Buy Limit and Sell Limit compete against each other on the same market state.
- Entry distance is optimized: the engine can test multiple distances rather than assuming one fixed offset works for every pair and session.
- Fill chance is separate: a beautiful TP chance is useless if the pending order almost never triggers, so fill probability is shown separately.
- Robust win rate is used: Wilson lower-bound style logic helps avoid overtrusting a small sample that happened to win.
- Profit factor matters: PF checks gross winning potential versus gross losing potential, which is more serious than win rate alone.
- Ambiguous bars are handled conservatively: when OHLC cannot prove whether TP or SL hit first inside the same candle, conservative settings can count it against the trade.
What the Main Numbers Mean
The pending entry price, target price and stop price calculated for the selected order type using broker tick normalization.
The percentage of historical similar cases where the pending order actually triggered before expiry.
The percentage of filled orders that reached the take-profit before stop-loss inside the tested forward window.
Profit factor. A PF above 1.0 means historical gross wins exceeded gross losses for the tested sample; higher is better, but sample quality still matters.
Expected value in pips after modeled wins, losses and costs. A high win rate with negative EV is not a good plan.
Explains why a plan passed or failed, such as weak win rate, poor PF, low fill chance, small sample or negative expectancy.
Why the Tool Can Prefer a Lower Win Rate
A plan showing 90% win can still be worse if it triggered only a few times, has poor sample reliability, bad fill rate, low profit factor or negative expectancy after costs. The engine is built to avoid the common beginner mistake of choosing the highest percentage on the screen. It ranks the whole trade plan: probability, fill behavior, profit factor, expectancy, reliability, recent sample and risk.
Limited Source Snapshot
input double InpTakeProfitPips      = 15.0;
input int    InpD1BarsToRead        = 1100;
input int    InpH1BarsToRead        = 26000;
input double InpMinimumProfitFactor = 1.15;
input bool   InpUseAdvancedPatterns = true;

int  BuildNeighbors(...);
void EvaluateSetup(...);
int  SimulateOrder(...);
How to Read the Result
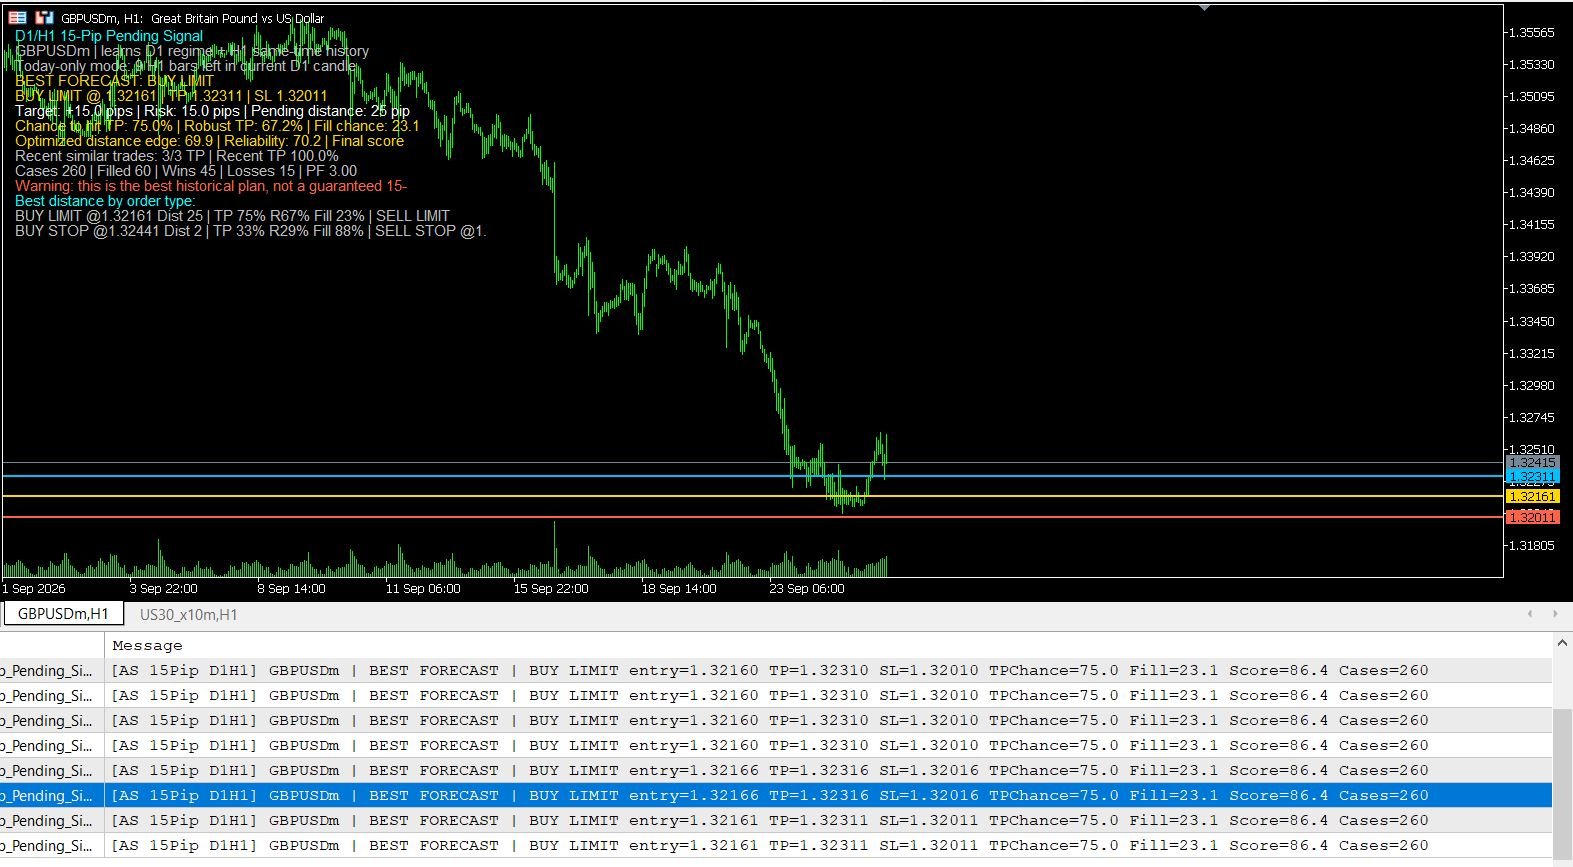
If the panel says BEST FORECAST: BUY LIMIT, it means the strongest historical plan among the tested pending-order styles was a buy limit at the printed entry level with the shown TP and SL. The fill chance tells whether similar pending orders usually triggered. TP chance tells whether triggered orders reached the target before the stop. PF means profit factor across the tested historical sample.
Technical Limits and Correct Usage
Because old H1 candles do not reveal exact tick order, no OHLC-based pending-order simulator can be identical to broker tick execution. Spread, slippage, stop-level restrictions, news spikes and broker feed differences can change live behavior. That is why this indicator exposes trigger rate, win rate, PF, EV, sample count and filters instead of showing only one aggressive signal.
