Multi-Timeframe Liquidity Sweep Trading Strategy — SMC & ICT Style for XAUUSD & EURUSD
A systematic approach that combines Smart Money Concepts, higher-timeframe bias, liquidity sweep detection, market structure shift confirmation, and precision retracement entries. Designed around XAUUSD and EURUSD during the highest-volume trading sessions with strict, rule-based risk management.
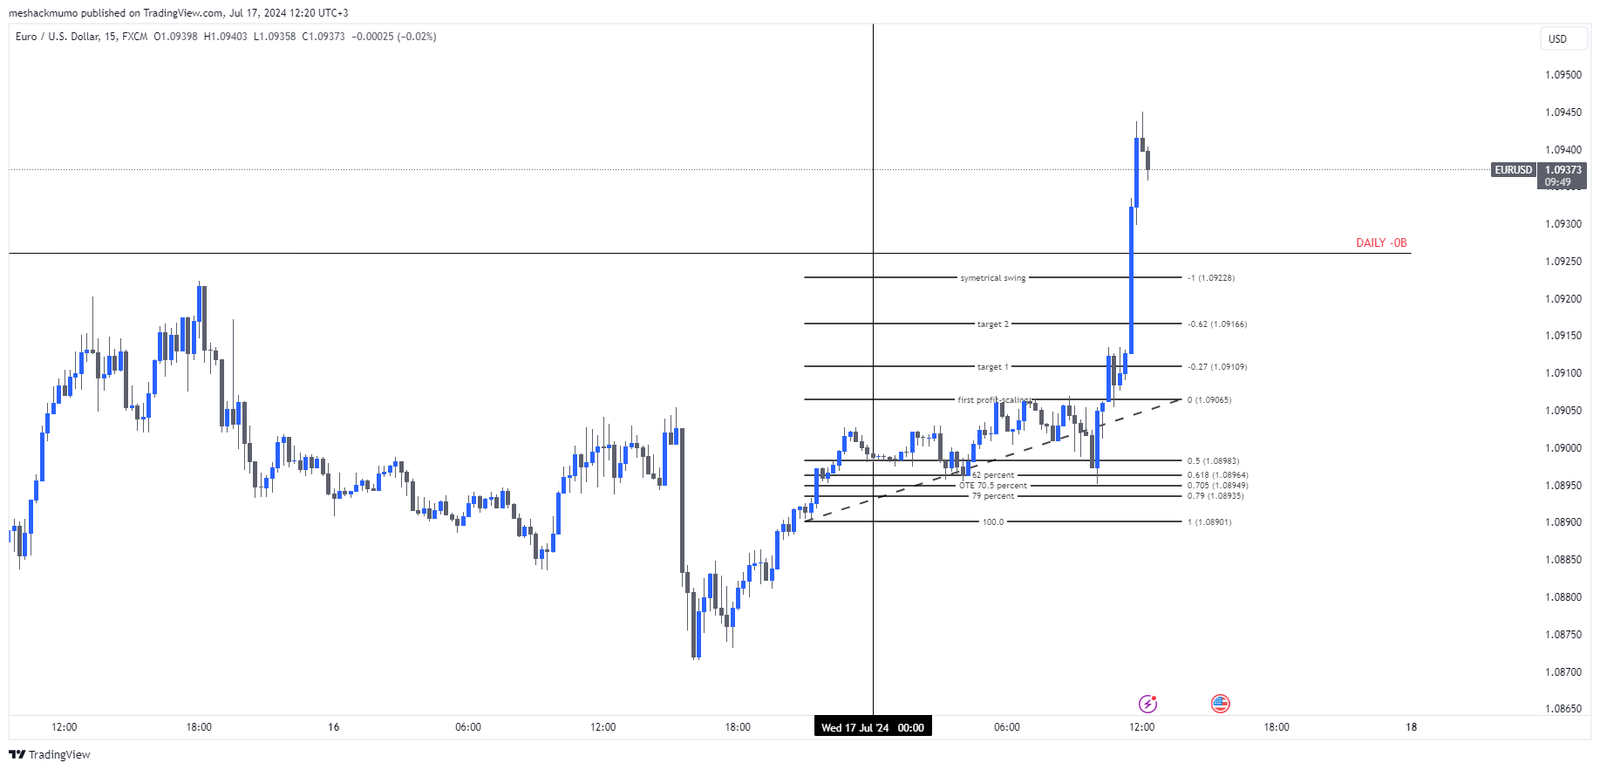
Table of Contents
- The Philosophy: Why Liquidity Drives Price
- The 4-Stage Decision Framework
- Stage 1 — Higher-Timeframe Bias (Daily + H4)
- Stage 2 — Liquidity Sweep Detection
- Stage 3 — Market Structure Shift Confirmation
- Stage 4 — Retracement Entry & Trade Management
- Session, News & Volatility Filters
- Risk Management Rules
- Applying This to XAUUSD (Gold)
- Automation Potential
- Frequently Asked Questions
The Philosophy: Why Liquidity Drives Price
Most retail traders enter at the wrong time — they buy breakouts that fail or sell breakdowns that reverse. The reason is structural: institutional traders and algorithms need liquidity to execute large orders. They cannot simply buy 1,000 lots of XAUUSD at market — there isn't enough resting liquidity at any single price level to absorb that order without massive slippage.
So they create liquidity. They push price through an obvious level — a recent swing high or swing low — triggering the stop-loss orders clustered there and activating the pending breakout entries. That cluster of orders IS the liquidity. Once consumed, price reverses and the real move begins in the opposite direction. The traders who entered on the breakout are now trapped on the wrong side. Their eventual stop-outs will fuel the next leg.
This strategy is built entirely around identifying, confirming, and entering these liquidity-driven reversals — but with a critical distinction: not every sweep is a trade. The framework applies multiple layers of filtering (trend alignment, session, news, volatility, structure confirmation) before any entry. The goal is not to catch every sweep. The goal is to catch the sweeps that have the highest probability of producing sustained directional moves.
The 4-Stage Decision Framework
Every trade decision follows the same sequential pipeline. No stage can be skipped. If any stage fails to produce a valid signal, the setup is abandoned — no exceptions. This sequential filtering is what separates a systematic approach from discretionary guesswork.
Before any of these stages execute, the strategy checks: Is the current time within the London or New York session? Is there high-impact news within 15 minutes? Is ATR above the minimum threshold? Is spread below the maximum threshold? If any pre-condition fails, the entire pipeline is skipped.
Stage 1 — Higher-Timeframe Bias (Daily + H4)
The single biggest mistake traders make with liquidity sweeps: trading against the higher-timeframe trend. A bullish sweep on M15 means nothing if the H4 and Daily charts are in a strong downtrend. The higher-timeframe gravity will pull price back down, turning what looked like a reversal into a continuation trap.
Bullish bias requires: Price on H4 is above the 200 EMA. The last confirmed swing high has been broken (higher high). The last confirmed swing low remains intact (no lower low). This confirms an uptrend structure on the higher timeframe.
Bearish bias requires: Price on H4 is below the 200 EMA. The last confirmed swing low has been broken (lower low). The last confirmed swing high remains intact. This confirms a downtrend structure.
Daily direction filter: Beyond H4 structure, the Daily trend must align. If Daily is bullish, only long setups are considered (even if H4 shows a bearish sweep — it's counter-trend and filtered out). If Daily is bearish, only shorts. If Daily and H4 conflict — no trade. This eliminates the most common source of losing sweep trades: entering against the dominant trend.
Stage 2 — Liquidity Sweep Detection
A liquidity sweep is defined by two conditions occurring on the same candle:
- Break: Price trades beyond a recent structural level — below the lowest low of the preceding N candles for a bullish sweep, or above the highest high for a bearish sweep. The break must be meaningful — measured in points, not just a tick beyond the level.
- Reclaim: The candle closes back inside the previous range — above that low (bullish sweep) or below that high (bearish sweep). This closure confirms that the break was not genuine directional intent but rather a liquidity grab.
Visually, this appears as a wick that pierces through a level and then retracts. The wick IS the sweep. The body closing back inside the range IS the confirmation that liquidity was taken and rejected. Without the reclaim, it's just a breakout — not a sweep.
What makes a sweep high-quality: The level being swept should be an obvious structural point — a clear swing low or swing high that any trader looking at the chart would identify. Sweeps of obscure intra-range levels carry less weight because fewer orders are clustered there. The most reliable sweeps occur at levels tested multiple times — each prior test accumulated more stop-loss orders and pending entries at that price.
Stage 3 — Market Structure Shift (MSS) Confirmation
A sweep alone is not a trade signal. Many sweeps fail — price sweeps liquidity, then continues in the original direction rather than reversing. The critical filter: wait for a Market Structure Shift.
Bullish MSS: After a bullish liquidity sweep (price broke below a low and reclaimed), wait for price to close above the last lower high that formed during the prior downtrend. This confirms the downtrend structure is broken. A lower high is a swing high that is lower than the previous swing high — the defining characteristic of a downtrend. Breaking above it signals that the sequence of lower highs has ended.
Bearish MSS: After a bearish sweep (price broke above a high and reclaimed), wait for price to close below the last higher low that formed during the prior uptrend. This confirms the uptrend structure is broken.
Why MSS matters: Without MSS, a sweep is unconfirmed. Price might sweep liquidity and continue trending — trapping traders who entered prematurely on the assumption of reversal. MSS is the market's way of saying "the prior trend structure is no longer valid." It's the difference between a trade setup and a guess. On the chart above, you can see the annotated MSS point where price closes beyond the prior structural swing point before any entry is considered.
Stage 4 — Retracement Entry & Trade Management
Even after a confirmed sweep + MSS, entering immediately at market is suboptimal. Price has just made a strong impulsive move (the MSS break). Entering at the extreme of that move means your stop loss must be wide — placed behind the sweep low/high, which is now far away. Wide stops mean smaller position sizes for the same risk. Smaller positions mean lower returns.
The solution: Wait for a retracement. After the MSS break, price typically pulls back into a zone defined by the signal candle's range or by Fibonacci retracement levels measured from the sweep low to the MSS high (for longs) or sweep high to MSS low (for shorts). Entering on the retracement achieves two things: a tighter stop (closer to the sweep level) and a better risk-reward ratio.
Stop Loss Placement
For long trades: stop loss is placed below the liquidity sweep low by a buffer of X points. This buffer accounts for spread widening and minor noise — preventing premature stop-outs from normal market fluctuation while keeping the stop structurally sound. If price returns to the sweep low after the MSS has confirmed, the setup is invalidated — the sweep was not genuine.
Profit Targets — Three Tiers
Target 1 (1R): Risk-unit equivalent. Optional partial exit — take 50% off, move stop to breakeven. This secures a risk-free trade and reduces emotional pressure.
Target 2 (2R): Twice the risk distance. Second partial exit. At this point the trade is profitable regardless of what happens next.
Target 3: The opposite liquidity level or a predefined structural level — where liquidity is expected to rest on the other side of the range. This is where institutions are likely to take profits or initiate opposing positions, making it a natural reversal zone.
Session, News & Volatility Filters
Session Filter — London & New York Only
This strategy only operates during the London and New York trading sessions. No trades are taken during the Asian session or during weekend/pre-market hours. The reasoning is structural: London and New York account for over 70% of daily forex volume. Liquidity sweeps during these sessions are backed by genuine institutional order flow. Sweeps during low-volume periods often lack the participation needed for sustained follow-through — they're more likely to be noise than signal.
News Filter — 15 Minutes Before and After
No new positions are opened within 15 minutes before or after high-impact news events. During news releases, spreads widen dramatically and price behavior becomes erratic — sweeps that occur during news are often violent, unpredictable, and prone to whipsaw. The filter applies to red-folder events: NFP, CPI, FOMC, GDP, and central bank rate decisions.
Volatility & Spread Filters
ATR(14) must exceed a minimum threshold before any trade is considered. Below this threshold, the market is too slow for the strategy's expected follow-through. Similarly, the current spread must be below a maximum — wide spreads eat into the already-tight stop loss and reduce the effective risk-reward. These filters prevent entering during low-volatility chop where sweep signals are statistically unreliable.
Trade Cancellation Rules
A setup is cancelled if: price reaches the intended target before entry (the opportunity passed), the trend filter changes direction (bias invalidated), the maximum waiting time for retracement expires (price isn't coming back), or volatility drops below the minimum threshold mid-setup (market died). These rules prevent chasing and force-entering deteriorating setups.
Risk Management Rules
| Rule | Value | Purpose |
|---|---|---|
| Risk per trade | 0.5% – 1% | Preserves capital during losing streaks. A 10-trade losing streak at 1% = 10% drawdown — survivable. |
| Max trades per day | 2 | Prevents overtrading. Quality over quantity. Two high-probability setups are better than five mediocre ones. |
| Consecutive loss stop | 2 losses | Circuit breaker. After 2 losses, stop for the day. Prevents revenge trading and tilt. |
| Max daily drawdown | 2% | Hard stop. If equity drops 2% from day-start, all positions close. Trading halts until next session. |
These rules are not suggestions. They are the difference between a strategy that survives long enough for its edge to manifest and a strategy that blows up during its first losing streak. A 55% win-rate strategy will experience 5 consecutive losses roughly once every 50-70 trades. Without these limits, that streak wipes out enough capital that recovering becomes mathematically difficult. With these limits, the streak is absorbed and the strategy continues.
Applying This to XAUUSD (Gold)
XAUUSD is the primary instrument for this strategy — and for good reason. Gold's market structure is unusually clean compared to currency pairs. It respects technical levels more consistently, produces clearer swing points, and generates stronger directional moves after confirmed sweeps. The higher volatility of gold (XAUUSD ATR is typically 1.5-2x that of EURUSD) means that sweep distances, stop buffers, and profit targets must be calibrated differently for gold than for forex pairs.
Key differences when trading XAUUSD: Sweep distances are wider (gold moves in larger increments). Stop-loss buffers must account for gold's higher intra-bar volatility — a stop that would be safe on EURUSD may get hit by normal noise on XAUUSD. Profit targets should be scaled to gold's average daily range rather than using fixed pip values. The London/NY overlap (12:00-16:00 GMT) is the optimal window for XAUUSD sweeps — this is when gold sees its highest volume and cleanest structural moves.
For traders using this strategy on XAUUSD specifically, we recommend starting with our free XAUUSD M30 historical dataset to backtest sweep behavior on gold across different market regimes before committing real capital.
Automation Potential — From Manual to Algorithmic
This strategy is exceptionally well-suited for automation. Every decision point is a binary or threshold-based condition: Is it London or NY session? Yes/No. Is H4 trend bullish? Yes/No. Did a bullish sweep occur? Yes/No. Has MSS confirmed? Yes/No. Is price in the retracement zone? Yes/No. Each stage produces a clear go/no-go signal, making the strategy translatable into MQL5 code with minimal ambiguity.
An EA implementation would follow the exact sequential pipeline: session check → news check → trend alignment check → sweep detection (using MqlRates high/low vs rolling N-bar extremes) → MSS confirmation (comparing current close to prior swing points) → retracement entry trigger → position sizing from account equity × risk% ÷ stop distance → order placement with SL/TP → trade monitoring with trailing rules → daily drawdown enforcement.
The strategy's multiple cancellation conditions (timeout, trend change, volatility drop) make it robust in live markets — the EA knows when to abandon a setup, not just when to enter one. For MQL5 code prompts that generate liquidity-sweep detection logic, see our MQL Prompts library. For a custom EA built to your exact specification, contact us for a quote.
Frequently Asked Questions
What is a liquidity sweep in forex trading?
A liquidity sweep occurs when price temporarily breaks a key structural level — a recent swing low or high — to trigger stop-loss orders and pending entries resting there, then immediately reverses. It's the signature of institutional order flow consuming retail liquidity before the real directional move begins. Bullish sweep = breaks below a low, closes back above. Bearish sweep = breaks above a high, closes back below.
What is Market Structure Shift (MSS) in SMC trading?
MSS is the first structural confirmation that a trend reversal may be underway. After a bullish sweep, MSS = price closes above the last lower high (breaking the downtrend structure). After a bearish sweep, MSS = price closes below the last higher low. Without MSS, a sweep is unconfirmed — many sweeps fail to produce reversals. MSS is the filter that separates high-probability setups from noise.
Why trade liquidity sweeps only during London and New York sessions?
London and New York account for over 70% of daily forex volume. Sweeps during these sessions are driven by genuine institutional order flow and have higher probability of sustained follow-through. Asian session sweeps often lack the volume to sustain the reversal — they're more likely to be noise than actionable setups. Session filtering alone eliminates a significant percentage of losing trades.
Can this strategy be used for XAUUSD (Gold)?
Yes — XAUUSD is the primary instrument for this strategy. Gold produces cleaner structural swings and stronger post-sweep directional moves than most forex pairs. However, parameters must be gold-calibrated: wider sweep distances, larger stop buffers (gold ATR is 1.5-2x EURUSD), and targets scaled to gold's daily range. The London/NY overlap is the optimal window for XAUUSD sweep setups.
Can liquidity sweep strategies be automated in MT5?
Yes — the sequential, rule-based nature of this strategy makes it ideal for MQL5 automation. Every stage (session check, trend alignment, sweep detection, MSS confirmation, retracement entry) is a binary or threshold-based condition. An EA can execute the entire pipeline consistently without emotion. See our MQL Prompts library for sweep-detection code templates. Contact us for custom EA development.
Build Your Liquidity Sweep Trading System
This strategy is systematic for a reason — it's designed to be automated. Whether you want to backtest it on historical XAUUSD data, generate MQL5 code for sweep detection, or commission a fully custom EA with these exact rules and risk parameters — we build trading systems that execute what you design.





