Pullback or Reversal? How to Tell in Real Time
Five structural tests, one scoring framework, and a worked example where the market switches classification mid-move — with the exact numbers on screen.
Every trend trader has lived this moment: price is running against your position, and the question arrives with your heart rate — is this the pullback I planned for, or the reversal I feared? This article refuses the fake answer. Nobody can tell you in advance. What can be done — and what this article teaches — is to classify the move continuously with five defined tests, act on the current classification, and update without denial when the evidence changes. That is not a lesser skill than prediction. In trading, it is the only real one.
The Honest Framing First
Start from the mechanical truth established in Why Pullbacks Happen: a pullback and a reversal begin identically. Both start with profit-taking, both produce counter-move candles, and both look like "a dip" for the first several bars. The difference between them is not visible in their beginnings — it emerges from how the counter-move interacts with structure. Which means the question "pullback or reversal?" is not answered once, at the start. It is re-answered at every structural event, and the answer can flip back and forth:
- Pullback → reversal: the defining level is closed beyond.
- Reversal → pullback: the broken level is reclaimed and the trend resumes (a failed break — one of the most reliable continuation setups in existence).
A trader who "decides" at the start and defends the decision for the rest of the move is guaranteed to be wrong half the time, and — worse — guaranteed to hold the wrong side of the second flip, because they stopped listening. The method below replaces decision with procedure.
The Five Live Tests
Each test is defined with our series conventions: pivots are strict fractals (L=3, R=3) confirmed three bars later; all tests are evaluated on candle closes, not wicks. The tests are ordered from decisive to contextual.
Test 1 — The master test: has the defining level been closed beyond?
The defining level in an uptrend is the most recent confirmed higher low. Closes above it → pullback logic applies, full stop. A close below it → the structure has broken; continuation logic is dead and reversal logic applies until a reclaim occurs. This single test resolves 80% of the question, and every other test only adjusts the odds around it. Wicks through the level are tolerated by design — they are sweeps. Closes through it are decisions.
Test 2 — The quality test: has a lower high formed?
A lower high is a confirmed swing high that fails to exceed the previous confirmed swing high. It does not call a reversal — lower highs are a normal feature of healthy pullbacks — but it removes the setup's A-grade status. Operationally: once a lower high is confirmed, no new entries in the trend direction, and existing positions tighten management to the pullback's own structure. If the defining level then holds and a new high forms, the warning is cleared; if the level breaks, the lower high becomes the first brick of the reversal's new sequence.
Test 3 — The momentum test: are the counter-move's candles bigger than the trend's?
Compare the average range of the counter-move's bars to the average range of the impulse that preceded it. A pullback shows contraction: smaller bodies, overlapping closes, declining activity — the signature of a pause. A developing reversal shows expansion: bodies comparable to or larger than the impulse's, closes near extremes, activity rising. The tell is visible several bars before any structure breaks, which makes it the earliest warning available — and the reason a disciplined trader stops adding early rather than late.
Test 4 — The time test: which side is consuming more bars?
Measure the impulse and the counter-move in bars. Pullbacks typically consume fewer bars than the impulse they correct — the trend is eager, the pause is brief. When the counter-move consumes more bars than the impulse took to form, the market's time is being spent against the trend, which usually indicates a correction or reversal in progress rather than a pause. This test is coarse, but it is independent of candle size, which makes it a useful cross-check on Test 3.
Test 5 — The context test: what does the timeframe above say?
Classify the same structure on the timeframe one step higher (H1 trade → H4 context; H4 trade → D1 context). If the higher timeframe's defining level is intact, the lower timeframe's counter-move is, at worst, the higher timeframe's pullback proceeding — the trend context survives. If the higher timeframe's level has also broken, the classification escalates: you are no longer inside a pullback, you are inside a reversal that spans your execution timeframe. Test 5 does not override Tests 1–4; it changes position sizing and patience.
The Scoring Framework
Count the warnings (Tests 2–5) alongside the master test (Test 1):
| Master test | Warnings (2–5) | Classification | Action |
|---|---|---|---|
| Level held | 0–1 | Pullback armed | Wait for the trigger; execute the written plan on it. |
| Level held | 2–3 | Ambiguous / suspect | No new risk. Manage existing positions at structure. Wait for trigger or break. |
| Level held | 4 | Fragile | Treat as pre-break: reduce exposure proactively, no adds under any circumstance. |
| Level broken (close) | any | Reversal (structure break) | Exit continuation positions on the close. New counter-trend entries only per pre-written rules. |
The framework's value is that it converts a terrifying judgment call into a count. Counting is repeatable; terror is not. And notice the asymmetry built into the table: warnings reduce risk before the break, which means that by the time the master test flips, the disciplined trader is already light — the reversal costs them little because they stopped feeding the position while it was merely suspect.
Worked Example — The Switch, With Numbers
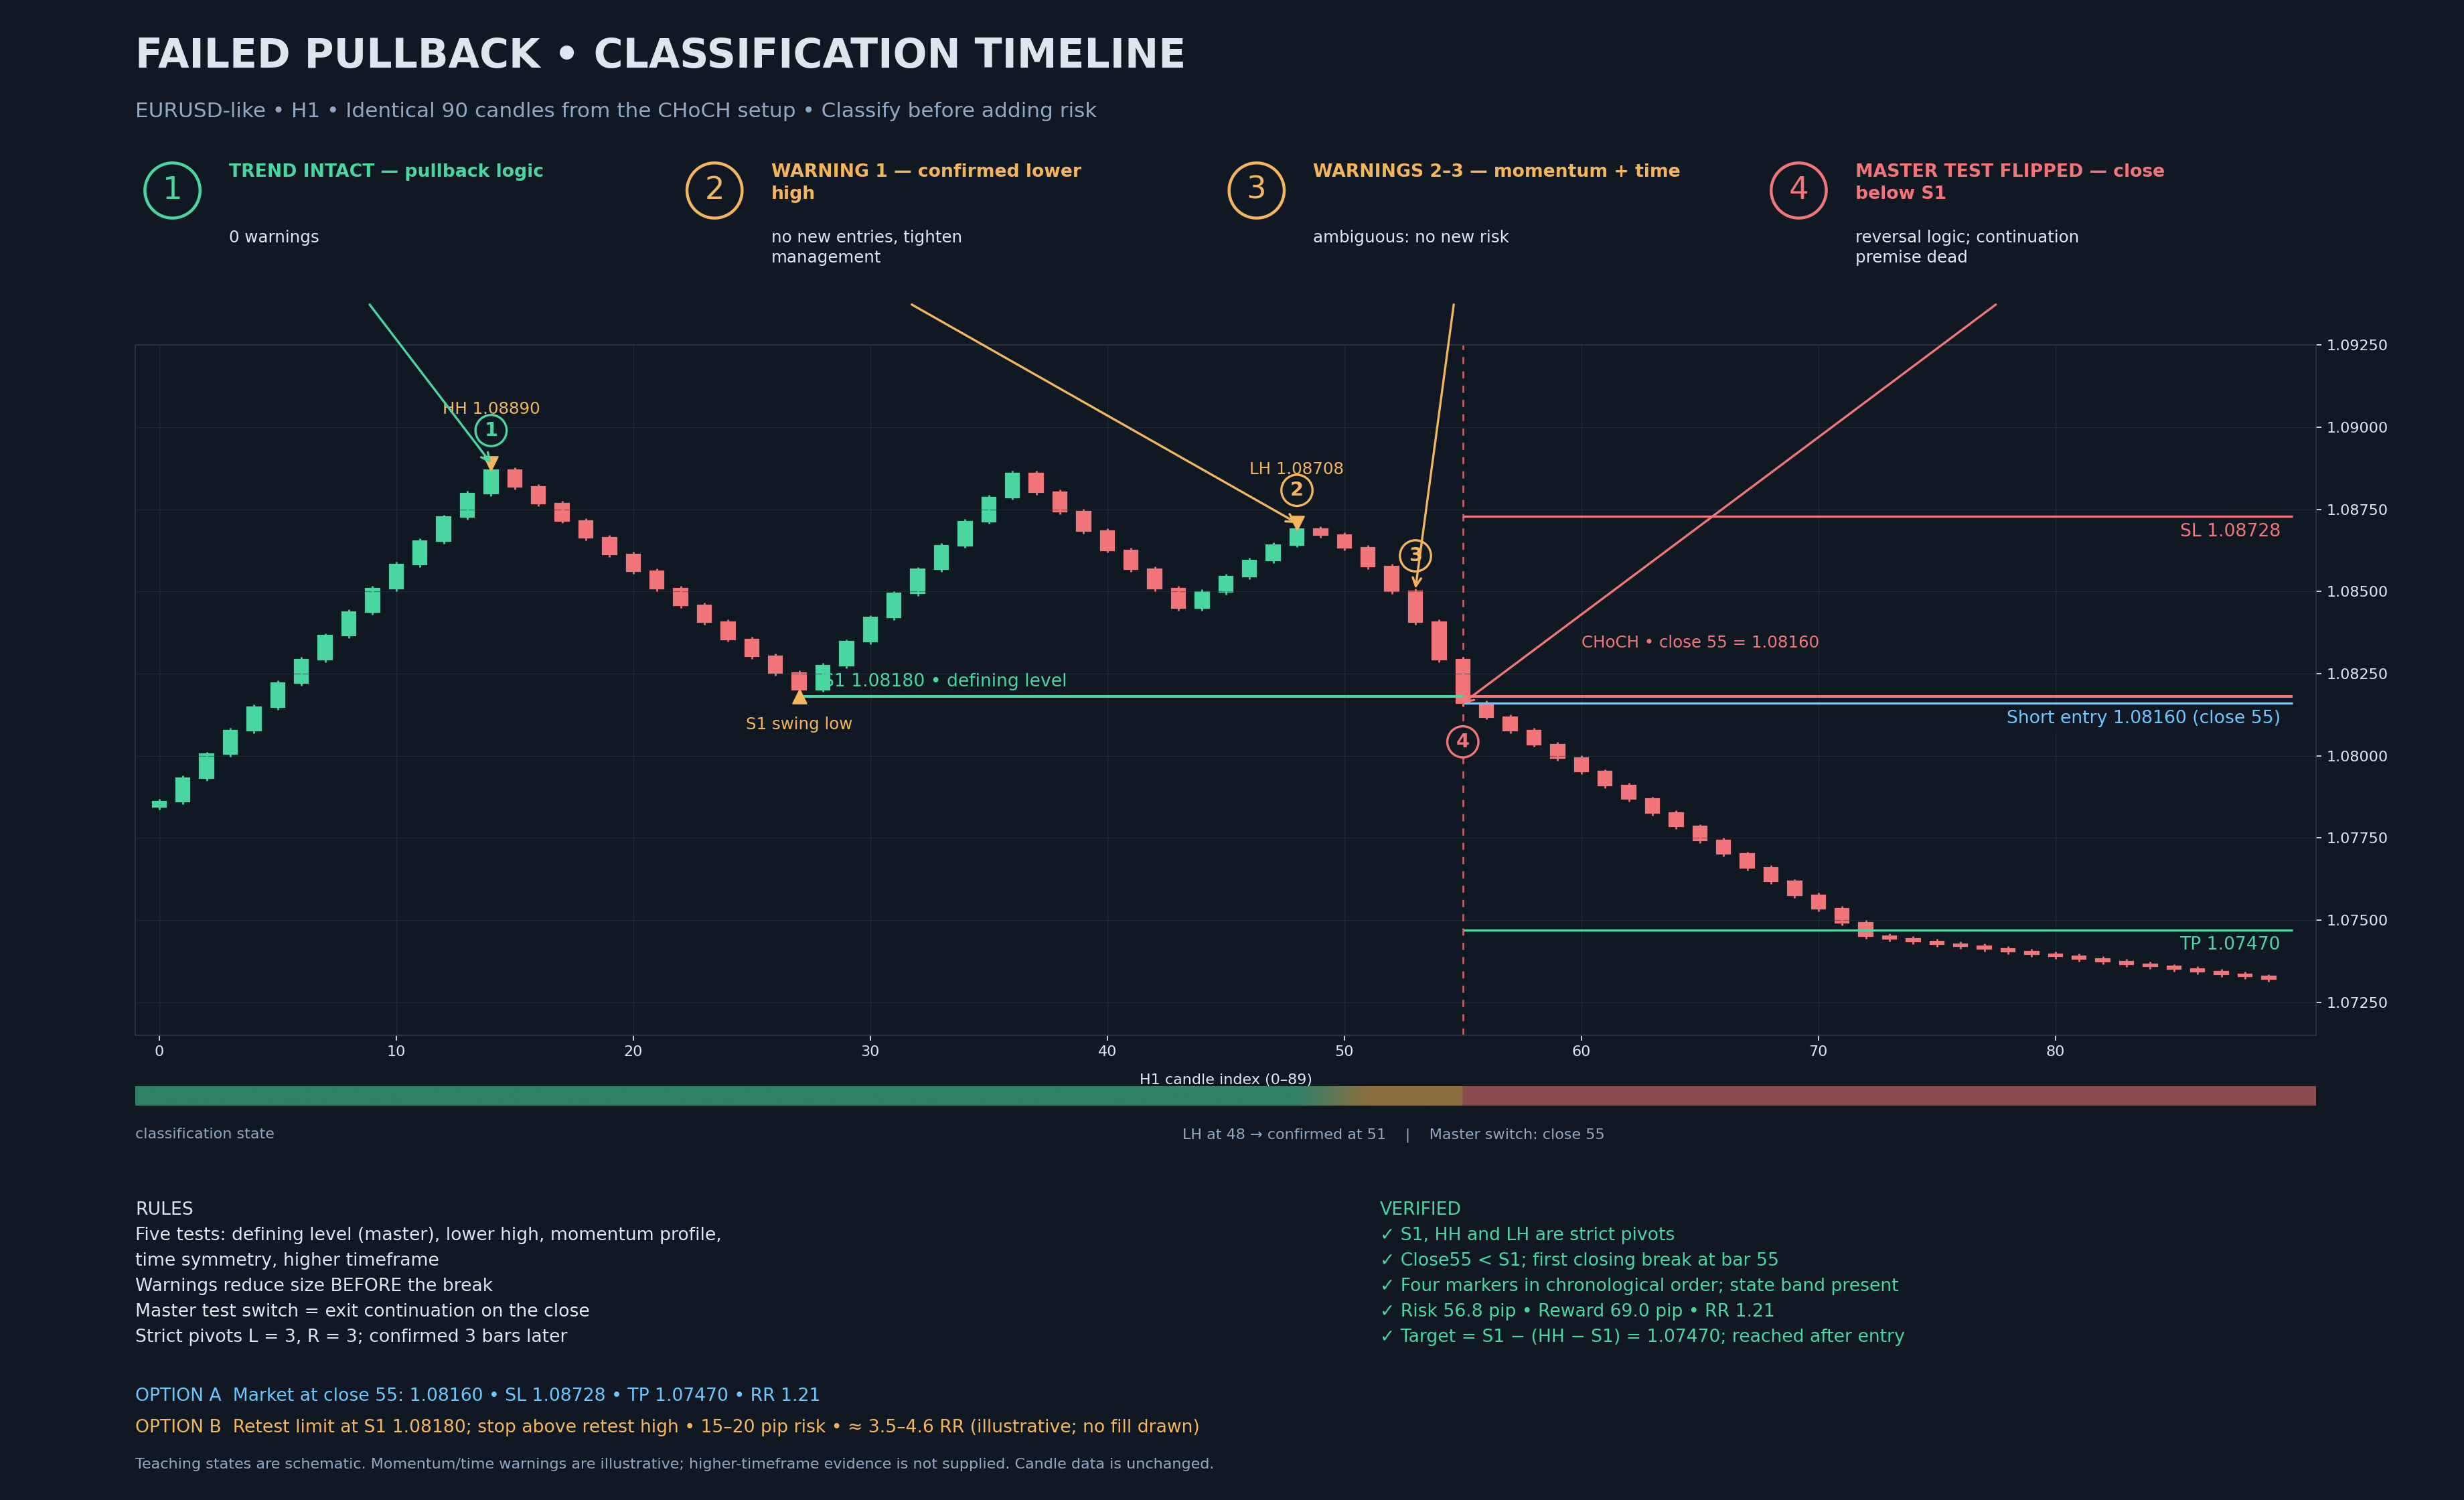
From the verified failed-pullback chart in this series (synthetic EURUSD-like H1 data). Follow the classification as the information actually arrived:
| Bar | Event | Classification after the event |
|---|---|---|
| — | Uptrend: confirmed higher low S1 = 1.08180; confirmed higher high HH = 1.08890 | Trend intact. Pullback logic applies; S1 is the defining level. |
| — | Counter-move begins; overlapping, contracting candles | Pullback in progress. 0 warnings. Destinations armed; trigger awaited. |
| — | Bounce fails at LH = 1.08708 — a confirmed lower high | Warning 1. A-grade status removed. No new entries. Management tightened. |
| — | Decline continues with expanding bodies; counter-move now longer in bars than the bounce leg | Warnings 2–3 (momentum, time). Classification: ambiguous/suspect. Still no new risk. |
| 55 | Close 1.08160 — first close below S1 (1.08180) | Master test flipped. Reversal (structure break). Continuation premise dead; exit on this close. |
Now the arithmetic of both responses, stated honestly:
The trend-follower who followed the framework: they stopped adding at the lower high, tightened to the pullback structure, and exited on the CHoCH close. Their worst case was a reduced-position loss; their original stop (if they held from the impulse) would have been the structural stop below S1 — the framework's warnings meant they carried materially less into the break.
The reversal trader's two entry options (a separate decision from the exit): market entry at the CHoCH close of 1.08160 with a stop above LH plus the standard 2-pip buffer (1.08728) carries 56.8 pips of risk against a measured target of 1.08180 − (1.08890 − 1.08180) = 1.07470, or 69.0 pips of reward — a reward-to-risk of 1.21. Waiting for a retest of the broken S1 (1.08180) from below with a stop above the retest high produces 15–20 pips of risk against the same target — reward-to-risk of roughly 3.5–4.6, at the cost of possibly missing the move entirely. Both are defensible; neither is improvised. The point of the walkthrough is that every number was knowable at the moment of decision — no hindsight required.
The Cost of Both Classification Errors
The framework exists because both ways of being wrong are expensive, and they are wrong in different currencies.
Error 1 — Treating a reversal as a pullback. The cost is the stop. If your invalidation is honest (a close beyond the defining level) the loss is bounded and known in advance — in the example above, the structural stop was 56.8 pips from the CHoCH entry, and less if the framework had already reduced exposure. This error's danger is not the loss itself; it is the denial that follows it — averaging down, widening the stop, "giving it room" — which converts a bounded cost into an account event.
Error 2 — Treating a pullback as a reversal. The cost is paid in spreads and missed continuation. A trader who exits and re-enters at every warning pays the round-trip cost repeatedly: on EURUSD with a 1.0-pip spread, twelve premature round trips a month cost roughly 12 pips in spread alone — plus slippage, plus the drift between exit and re-entry price, plus the setups that leave without them. In the worked example, a trader who exited at Warning 1 (the lower high) and re-entered on the eventual trigger would have paid two extra round trips and re-entered 20+ pips worse if the trend had simply continued to a new high.
The framework's design responds to both: warnings reduce risk gradually (softening Error 1's exposure without paying Error 2's full spread bill), while the master test gives Error 1 a single, final, unambiguous trigger. You never exit on suspicion; you always exit on structure.
The Contrast Case — The Same Five Tests on a Pullback That Held
A framework that only detects reversals is half a framework. Run the same five tests on the verified EMA pullback from this series (synthetic EURUSD-like H1 data) — the case that resolved as continuation — and watch the scores stay clean:
| Test | What the chart showed | Score |
|---|---|---|
| 1 — Defining level | The most recent confirmed higher low (HL2 = 1.08778) was never threatened; the pullback low stayed far above it. | Held ✓ |
| 2 — Lower high | No confirmed lower high formed before the resumption — the pullback never even produced a bounce that failed. | 0 warnings |
| 3 — Momentum | Twelve pullback bars with contracting ranges; no counter-move candle matched the impulse's average range. | 0 warnings |
| 4 — Time | The pullback consumed fewer bars than the impulse leg it corrected. | 0 warnings |
| 5 — Higher timeframe | H4 structure (same pivot convention) was trending up with its own defining level intact. | 0 warnings |
Classification throughout: pullback armed, then pullback executing. The interaction phase produced the expected minimal sweep — the low pierced the EMA50 by exactly 1 pip (the stop cluster under the average, consumed) — and the close stayed within 2 pips of the EMA. The engulfing trigger fired on the close, the entry went in at 1.09119, the stop sat at the pullback low minus the ATR-scaled buffer (1.08959 — 16.0 pips of risk), and the trend resumed to the measured target. No test ever scored a warning, so no risk-reduction step was ever triggered — the position was carried at full planned size from trigger to target.
Put the two cases side by side and the framework's behaviour is exactly what it should be:
- Clean case (this one): 0 warnings → full size, hold to targets, no interference.
- Switch case (the failed pullback): warnings accumulated in sequence → risk reduced before the break → the break cost a fraction of a full-size stop.
The most important line in both tables is the same: the classification was never a guess. Every cell was computable from closes that existed at the time. The framework does not make you right — it makes you early and light when you are about to be wrong, and full-sized and patient when you are not.
Building Your Classification Journal
The five tests become personal skill only through repetition with feedback. The mechanism is a one-line-per-event journal, kept for thirty to fifty counter-moves per instrument. The format is deliberately small — if it takes more than a minute to log, you will stop doing it:
| Field | Example entry |
|---|---|
| Date / instrument / TF | Oct 14 / EURUSD H1 |
| Defining level (from confirmed pivot) | 1.08180 |
| Warnings observed (tests 2–5, as a count and which) | 3 — LH, momentum, time |
| Master test outcome | Broke: close 1.08160 |
| Resolution | Continuation down (measured move reached) |
| Regime at event (ATR14) | 11.2 pips |
After thirty entries you can answer questions no article can answer for you: On my instrument, how often do 2+ warnings end in a break rather than a resumption? Is my classification systematically late (breaks happen while I still score 0–1 warnings)? Do my errors cluster in one session or regime? The journal turns the framework from a set of rules into a measured process, and it produces the only base rates you should trust — your own.
Two calibration patterns are worth expecting. First, most traders discover their warnings arrive later than the market's — meaning they are scoring 0–1 warnings at events their journal later marks as breaks. The fix is not more tests; it is earlier honesty about Test 2 (the lower high) and Test 3 (momentum expansion), which are the two tests that lead the structure break rather than following it. Second, most traders discover one instrument where the framework needs a wider buffer or an extra confirmation bar — usually the most volatile instrument they trade. That is the ATR-scaling principle showing up in personal data, and the journal is where you find the number.
What Does Not Answer This Question
Four tools traders reach for that cannot do this job:
Oscillators (RSI, Stochastic). They measure momentum, not structure. "RSI is oversold" is a statement about speed, not about whether a swing level broke. In the worked example, RSI was printing oversold readings during the entire decline — including through the CHoCH — which would have argued for buying exactly when the structure said exit. Momentum resets constantly inside trends; structure does not lie about closes.
Depth alone. "It's retraced 61.8%, so it must be a pullback" — depth is a measurement, not a verdict. The example's reversal reached its break after a retracement that was, for most of its length, within perfectly normal pullback depth. The level, not the percentage, decided.
Moving averages. An EMA can act as a zone and even as a warning (a close well through a rising EMA is a behavioural change worth noting), but it is derived from the same closes as structure and adds no independent information. In our convention the EMA is a destination, never a classifier.
News and narrative. "It's falling because of the news" is a story about the past. Markets price information before narratives reach you, and the same headline can produce a 200-pip continuation or a two-bar wick. Trade the structure you can see; let commentators describe why it happened.
The One-Sentence Version
If everything above collapses into a single line to write on your monitor: hold pullback logic while closes hold the defining level; count warnings to decide your size; switch to reversal logic the moment a close breaks the level — and never argue with either verdict. The tests exist to make the count objective, the journal exists to calibrate it, and the asymmetry exists to keep you solvent while you learn. That is the entire craft of telling pullbacks from reversals — not a sixth sense, a procedure. Run the procedure for a quarter and the question in this article's title stops being frightening; it becomes a checklist item, answered in seconds, with your money positioned accordingly before the market finishes deciding.
FAQ
Can you tell a pullback from a reversal in advance?
No — the difference is confirmed only afterwards. What you can do is classify continuously with defined tests and act on the current classification: while the defining structure holds, pullback logic; once a close breaks it, reversal logic. The skill is updating without denial.
What is the single most reliable test?
Whether the trend's defining swing level has been closed beyond. Wicks through are sweeps; closes through are breaks. Every other test adjusts the odds around this master test.
How many lower highs does it take to call a reversal?
A lower high never calls a reversal by itself — it is a quality warning that stops new entries. The reversal is called by the structure break and confirmed by the new lower-high/lower-low sequence.
Why not just use RSI or MACD to detect reversals?
Oscillators measure momentum, not structure; momentum diverges and resets constantly inside trends. Indicators can add context to a structure-based classification — they cannot make it.
What should I do while the market is undecided?
Treat the ambiguous state as a no-new-risk state: manage existing positions to their structural rules, place no new entries, and wait for either the resumption trigger or the break. Most account damage happens in this state, not the obvious ones.
Does the framework work on indices, gold and crypto?
Yes — the tests are structural, so they transfer directly. What changes is calibration: more volatile instruments (gold, NAS100, crypto) produce deeper sweeps and faster warning accumulation, so expect to run wider ATR-scaled buffers and to score Test 3 (momentum) earlier. The journal is where each instrument's calibration gets measured rather than guessed.
Continue the Series
- Pullback Trading Strategy — The Complete Guide (pillar)
- Pullback vs Retracement vs Reversal
- Why Pullbacks Happen — Market Mechanics
- Failed Pullbacks — When Continuation Dies
- Pullback vs Breakout Entry
Structure Breaks, Classified Live
The Institutional Flow dashboard tracks BOS and CHoCH events across 50+ symbols with the same pivot conventions used in this guide.
Go from article to implementation
Read the proof, then test the idea with calculators, free tools, case studies and a fixed-price build path.
Go deeper before you build, download or automate
Hand-picked engineering articles, indicator breakdowns and trading-system tools so visitors keep exploring instead of leaving after one page.

Pine Script to MT4/MT5 Conversion Planner
Analyze Pine strategies, repainting risk, TradingView alert bridges, MTF synchronization and the correct MQL4/MQL5 build path before paying for conversion.
Open planner
3-in-1 MT5 Indicator Bundle
12H Bias Engine, Smart Money Institutional Flow Dashboard and D1/H1 pending-signal logic with MQ5 + EX5 source included via Etsy.

MT5 Bank Orders Institutional Flow Dashboard
Supply/demand zones, BOS/CHoCH, liquidity levels, FVG, equal highs/lows and confirmed trade-plan logic explained with EX5 download.

MT5 Asia London NY Liquidity Engine
Asia range, London raid and New York continuation/reversal planning with internal session backtest stats and entry/SL/TP dashboard.

Interactive Brokers RSI Pair Trader
Tkinter desktop trading workflow, TWS API connection handling, RSI pair logic, risk controls and custom IBKR development positioning.

XAUUSD M30 CSV Data For Backtesting
Use clean MT5 historical data for Python backtests, strategy validation, spread checks and realistic gold EA research workflows.