RSI Multi-Timeframe Price Levels & Daily Range Backtest — Two Free MT5 Indicators
One indicator projects exact price levels where RSI will hit thresholds across 4 timeframes. The other walk-forward backtests whether limit orders at those levels actually fill. Together they answer the two questions every trader needs: where to place orders and how likely they are to work.
RSI MTF Price Levels
M15/M30/H1/H4 RSI(22) with historical clustering + Wilder forward projection + confluence scoring
Download .ex5 (Free)Daily Range Backtest
Walk-forward validated limit order fill probability with H1+H4 bar-by-bar simulation + auto lot sizing
Download .ex5 (Free)The Problem These Indicators Solve
Every trader asks the same two questions before placing a limit order: "At what price should I place it?" and "What are the chances it actually fills and hits my target?"
Most traders answer the first question with guesswork — drawing horizontal lines, picking round numbers, or eyeballing support/resistance. Most never answer the second question at all — they place the order and find out what happens.
These two indicators turn both questions into quantifiable, backtested answers. The RSI Multi-Timeframe indicator tells you the exact price where RSI will hit oversold or overbought — computed from both historical pattern clustering AND forward RSI simulation. The Daily Range Backtest then tells you whether limit orders at those levels actually filled and hit TP on real historical data, using causal walk-forward validation.
Table of Contents
Indicator 1: RSI Multi-Timeframe Price Levels (RSI_MTF_PriceLevels)
This is not an RSI line indicator. It does not show you the RSI value. It shows you the exact price on your chart where RSI will hit its target levels — 80, 75, 25, and 20 — across all four timeframes simultaneously. Think of it as an RSI-to-price translator.

How It Works — Two Analysis Methods
Method A — Historical Price Clustering. The indicator scans the last 300 closed bars (configurable) on each timeframe independently. Every time RSI crosses a threshold — dropping below 25, crossing above 80 — it records the closing price at that moment. These prices are then clustered using ATR-normalized tolerance. The best cluster is selected using a 4-component scoring system: 35% frequency (how many crossings), 30% recency (how recently), 20% tightness (how close together the prices are), and 15% distance from current market. The output: a representative price, cluster bounds, occurrence count, and a relevance score.
Method B — Wilder RSI Forward Projection (unique to this indicator). This is what separates this indicator from every other RSI tool. The indicator implements its own Wilder RSI calculation to expose the smoothing state — avgGain and avgLoss values that the built-in MT5 iRSI function keeps hidden. Using this state, it runs a binary search solver: "Given the current Wilder state, what future close price would make RSI exactly equal to 80?" The solver converges monotonically (RSI is monotonic in the hypothetical close) with configurable tolerance and maximum iterations. Safety limits prevent projection into unrealistic price ranges.
Confluence Scoring Engine
Once all four timeframes produce their historical and estimated levels, the confluence engine combines everything into a single 0-100 confidence score using 7 independently weighted components:
- TF Agreement (25%): How many timeframes point to the same price region
- Historical Strength (15%): RSI crossing frequency at this level
- Clustering Tightness (15%): Standard deviation relative to tolerance
- Hist/Est Agreement (15%): How close are historical and estimated centers
- Higher-TF Weight (15%): H1 and H4 share of agreement
- Distance Band (10%): How far from current market price
- RSI Extremeness (5%): How close current RSI is to the target
The final score is labeled: WEAK (≤30), MODERATE (≤50), GOOD (≤70), STRONG (≤85), VERY STRONG (>85).
Dashboard + Chart Output
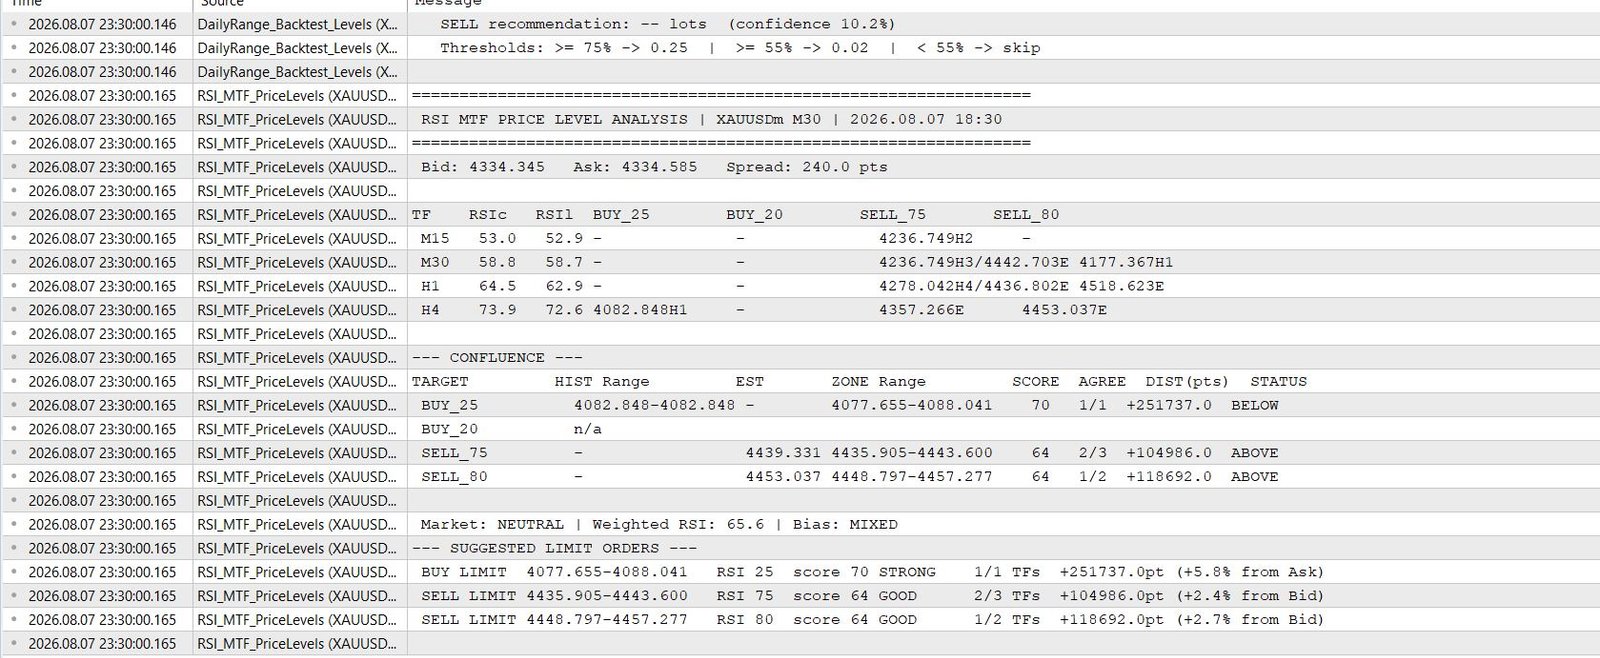
The on-chart dashboard shows: per-timeframe closed RSI and live RSI, estimated price levels with side-validity markers (A/B = valid, N = near, I = invalid, P = already past), the full confluence table with HIST/EST/ZONE/SCORE/AGREEMENT/DISTANCE, market state (weighted RSI across TFs), overall bias (buy/sell/mixed), and the strongest buy and sell zones.
On the chart: historical levels appear as solid lines, estimated levels as dashed lines, confluence zones as gold dash-dot lines with colored rectangles (green for buy zones, red for sell zones). Per-timeframe zones are optional.
Indicator 2: Daily Range Backtest Levels (DailyRange_Backtest_Levels)
This indicator answers the second question: if you place a limit order at a certain distance from the daily open, what percentage of days does it fill and hit your take-profit target? It answers with causal walk-forward validation — testing only on data the model has never seen.
How It Works
Training Phase. The indicator loads up to 500 D1 bars (Mon-Fri, GMT). It splits them: first 60% = training, last 40% = testing (out-of-sample). From the training data, it calculates: average daily range (pips), average up move (open→high), average down move (open→low), and per-day-of-week averages (Mon through Fri, with counts).
Order Placement. Using the training average range, it computes: Buy Limit = current Ask − (15% × avg range), Sell Limit = current Bid + (15% × avg range). The TP distance is configurable (default 20 pips). These are your suggested limit order levels for today.
Walk-Forward Backtest. For each day in the 40% test period, the indicator places virtual limit orders at the computed distances from that specific day's open. Then it runs bar-by-bar simulation: H1 bars (24 per day) and H4 bars (7 per day) to determine whether the order filled and whether TP was hit. Results are blended — the final confidence is the average of H1 and H4 hit rates.
Output and Auto Lot Sizing
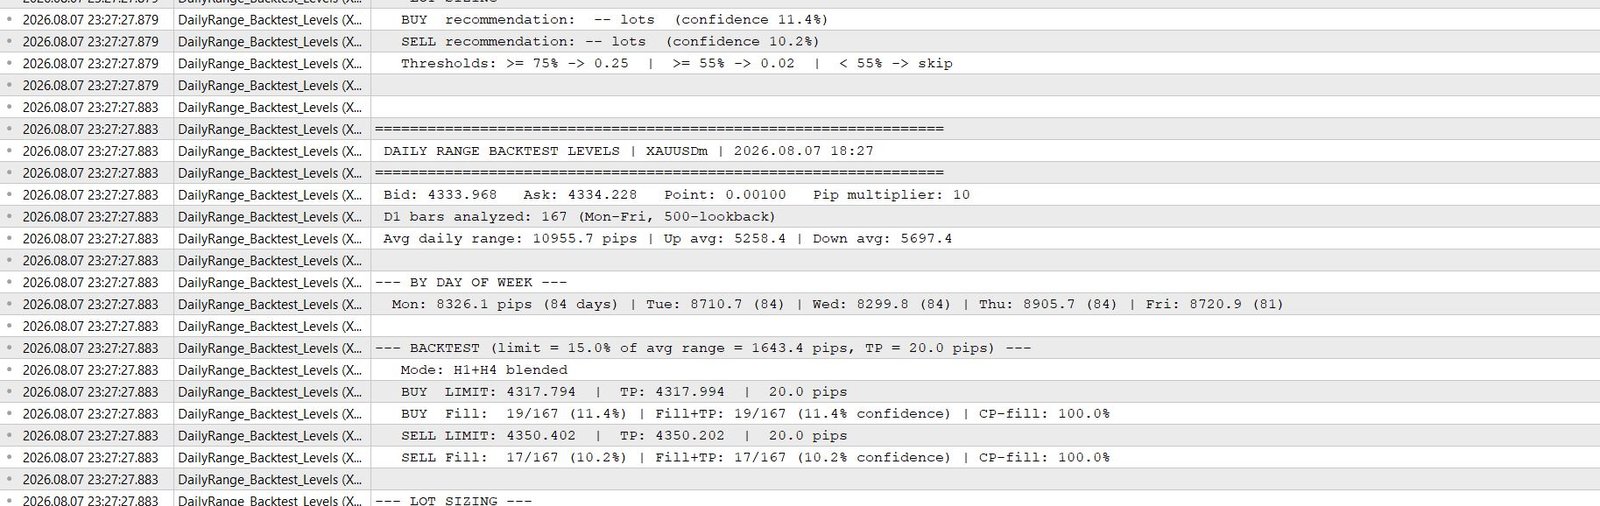
The dashboard shows: average daily range, per-day-of-week breakdown, suggested buy/sell limit prices with TP, fill probability (% of days order filled), fill+TP probability (confidence — % of days both filled AND TP hit), conditional TP% (given fill, how often TP hits), and per-timeframe breakdown (H1 fill/TP + H4 fill/TP).
Auto lot sizing: ≥75% confidence → 0.25 lots, ≥55% → 0.02 lots, below → skip. Thresholds are configurable.
On the chart: buy limit lines (green dashed), sell limit lines (red dashed), TP lines (green/red dotted). Levels only appear when confidence exceeds the minimum threshold.
How to Use Both Together — The Combined Workflow
These two indicators are designed to work as a unit. Here's the daily workflow:
Step 1 — Pre-Session Setup. Open your MT5 chart. Attach both RSI_MTF_PriceLevels and DailyRange_Backtest_Levels. Both dashboards appear on the chart. Review the RSI indicator's Confluence section — identify which RSI levels have GOOD (60+) or STRONG (70+) scores.
Step 2 — Find the Zones. The confluence zones on your chart show exactly where to place orders. A buy zone at RSI 25 with a score of 72 (GOOD) means historically, when RSI hit 25, price was in this zone 72% of the time across all timeframes. That's your candidate buy limit level.
Step 3 — Validate with Daily Range. Check the Daily Range dashboard. Do the backtest numbers support placing an order near that level? If the buy fill probability is 80% and the fill+TP confidence is 65%, you have a statistically validated setup. If fill is only 35%, skip it — the level exists but orders rarely fill there.
Step 4 — Size Properly. The Daily Range indicator tells you what lot size to use based on confidence. Don't override it. If it says 0.02 lots, use 0.02. If it says skip, skip. The size is derived from the same backtest data you're using for confidence.
Step 5 — Review End of Day. Both indicators print to the Experts tab. Save the output. Over weeks, you'll build a personal database of which levels worked and which didn't — on your specific pair, during your specific sessions. This data is more valuable than any pre-built indicator because it represents YOUR market conditions.
Installation Guide
- Download both .ex5 files using the buttons above
- Open MT5 → File → Open Data Folder → MQL5 → Indicators
- Copy both .ex5 files into the Indicators folder
- Restart MetaTrader 5 (or right-click the Navigator → Refresh)
- Both indicators appear under Navigator → Indicators
- Drag onto any chart. Both work on any symbol. RSI_MTF works on any timeframe (chart timeframe is ignored — it uses its own M15/M30/H1/H4 data). DailyRange works on any timeframe (always uses D1 for range analysis)
Key Input Parameters
| Parameter | Indicator | Default | What It Does |
|---|---|---|---|
| RSI_Period | RSI MTF | 22 | RSI period — 22 is smoother than standard 14, fewer false signals |
| RSI_Sell_Level_1/2 | RSI MTF | 80 / 75 | Overbought thresholds for sell limit projections |
| RSI_Buy_Level_1/2 | RSI MTF | 25 / 20 | Oversold thresholds for buy limit projections |
| WeightH4 / WeightH1 | RSI MTF | 3.0 / 2.0 | Higher weights for H4/H1 in confluence scoring (swing bias) |
| ClusterTolerancePercent | RSI MTF | 75 | Tolerance for grouping nearby prices (% of ATR) |
| D1_LookbackBars | Daily Range | 500 | D1 bars to analyze (0 = all available) |
| WalkForwardSplitPct | Daily Range | 60 | 60% train / 40% test. 0 = in-sample (biased) |
| TakeProfitPips | Daily Range | 20 | TP target in pips for backtest |
| MinConfidencePct | Daily Range | 55 | Minimum fill+TP% to suggest a level (0.02 lots) |
Get Both Source Codes — $130 One-Time
RSI_MTF_PriceLevels.mq5 (2,028 lines) + DailyRange_Backtest_Levels.mq5 (754 lines) · Complete source code · Full comments · Commercial use included
Own the code. Modify parameters deep in the logic. Integrate into your own EAs. Understand every calculation. One payment, no subscription.
Contact Us to Purchase Source Code — $130.ex5 files are free. Source code (.mq5) is $130 for both. Delivered via email within 24 hours.
Frequently Asked Questions
What does the RSI Multi-Timeframe Price Levels indicator do?
It projects exact price levels where RSI(22) will hit 80/75/25/20 across M15, M30, H1, and H4 timeframes. Uses two methods: historical price clustering (Method A) and Wilder RSI forward simulation with binary search (Method B). The confluence engine scores each level 0-100 with 7 weighted components. Outputs chart lines, zones, dashboard, and Experts tab report.
How does the Daily Range Backtest indicator work?
It analyzes D1 daily ranges with walk-forward split (60% train / 40% test). For each day in the test period, it simulates limit orders at configurable distances from the open, then runs H1 and H4 bar-by-bar backtest to check fill and TP. Final confidence is blended H1+H4 hit rate. Auto lot sizing: ≥75% → 0.25 lots, ≥55% → 0.02, below → skip.
How do I use both indicators together?
RSI indicator tells you WHERE (exact price levels with confluence scores). Daily Range tells you HOW LIKELY (fill + TP probability from walk-forward backtest). Only trade levels with both high RSI score AND high backtest confidence. Size according to Daily Range's auto lot recommendation.
What's the difference between free EX5 and paid source code?
EX5 files are compiled, ready-to-use indicators — completely free. You can change all input parameters. Source code ($130 for both) gives you the full .mq5 files: modify the core logic, integrate into your own EAs, change how clustering works, adjust the confluence scoring algorithm, or compile your own custom versions. Source code is delivered via email. Contact us to purchase.
Is RSI 22 better than RSI 14?
RSI(22) produces approximately 40-60% fewer threshold crossings than RSI(14), generating fewer but more reliable signals. It's a deliberate design choice for limit-order placement — you want fewer, higher-quality levels rather than frequent, noisy ones. The input parameter is configurable if you prefer a different period.
Does the RSI indicator repaint?
No. Method A uses only closed bars. Method B uses Wilder state from the last closed bar — projections don't change during the forming bar. Chart levels update only on new bar closes per timeframe. The live RSI shown on the dashboard updates every tick (ForwardRSI with forming bar close), but this is display-only and doesn't affect the price levels.
Start Trading with Data-Backed Levels
Download both indicators free. Use them on demo for 2 weeks. Review the Experts tab output daily. Once you've validated that the levels work on your pair, put real money behind them — sized according to the Daily Range's backtest confidence, not your gut.





