XAUUSD Market Structure Trading Strategy — 4H + 1H Analysis with EMA & RSI Confirmation
How to read gold's market structure across two timeframes, identify key decision levels, and time entries using EMA crossover with RSI confirmation. Built for prop firm risk parameters and MT5 execution.
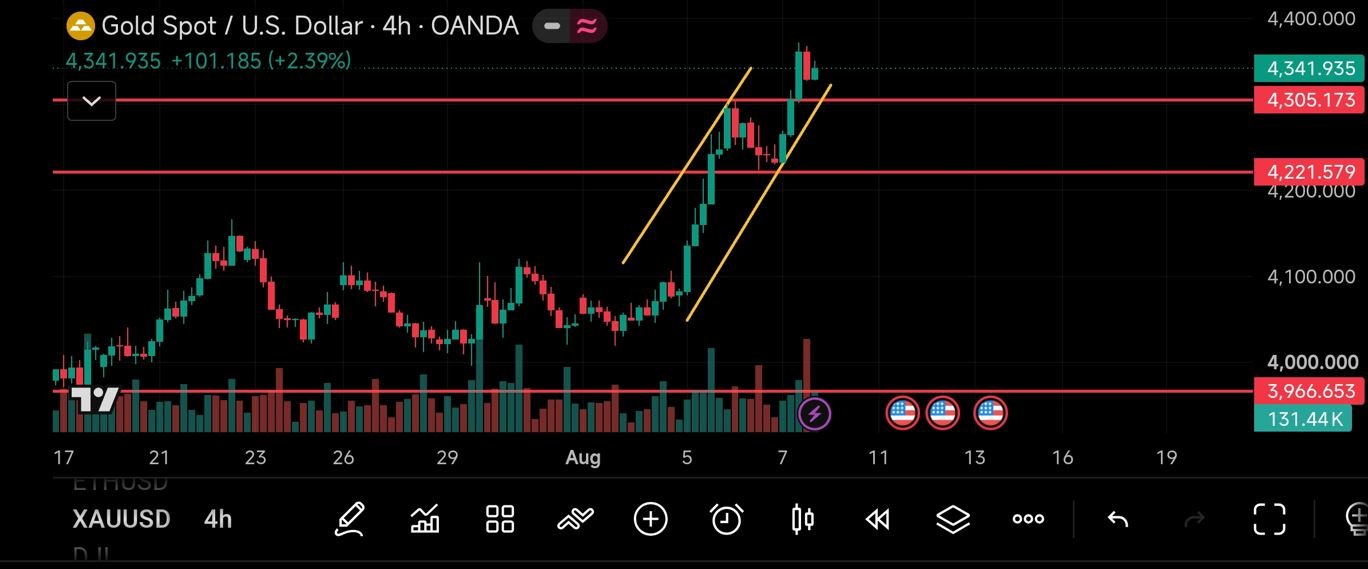
Table of Contents
- The Key XAUUSD Levels — A 3-Zone Decision Map
- Reading the 4H Chart — Directional Bias
- Reading the 1H Chart — Entry Precision
- The 4,305 Flip — Why This Level Matters Most
- The Complete Strategy Framework
- Bullish Setups — Pullback vs Breakout
- The Bearish Scenario — When Support Fails
- Prop Firm Risk Parameters — Why 1% Beats 2%
- Frequently Asked Questions
The Key XAUUSD Levels — A 3-Zone Decision Map
Gold's current market structure creates three distinct zones. Every trading decision flows from which zone price occupies.
| Zone | Price Range | Structural Meaning | Bias |
|---|---|---|---|
| Zone 1 | Above 4,305 | Bullish continuation. Resistance flipped to support. Trend intact. | Bullish |
| Zone 2 | Below 4,305, Above 4,221 | Correction or range. Structure weakening but not broken. | Neutral / Wait |
| Zone 3 | Below 4,221 | Major structural deterioration. Higher low violated. Trend change risk. | Bearish |
This is not a prediction. It's a decision framework. The zones tell you what type of trade is structurally valid — longs above 4,305, no new longs between 4,221-4,305, and short opportunities below 4,221. Price action within each zone determines timing.
Reading the 4H Chart — Directional Bias
The 4H chart is your compass. It tells you which direction the trade should face — not when to enter. The current XAUUSD 4H structure is unambiguous:
- Sequence of higher highs and higher lows from approximately 4,050 → 4,340
- Price is trading within an ascending channel — a rising trend structure
- 4,221 is the last major higher low — the structural floor of this trend
- 4,305 was resistance and has now been broken and potentially flipped to support
- Current price around 4,341 — near the top of the recent range, above the key 4,305 level
The 4H bias is bullish. This means only long setups or waiting. Shorts are structurally invalid while price holds above 4,305. Shorting simply because "gold went up too much" is fighting the dominant trend — a consistently losing approach in market structure trading.
Reading the 1H Chart — Entry Precision
If the 4H chart is the compass, the 1H chart is the GPS. It tells you where precisely to enter — and when to wait. The 1H shows the same bullish structure at higher resolution: 4,221 → 4,250 → 4,300 → 4,340+. Each swing produced a higher low, confirming the uptrend's health bar by bar.
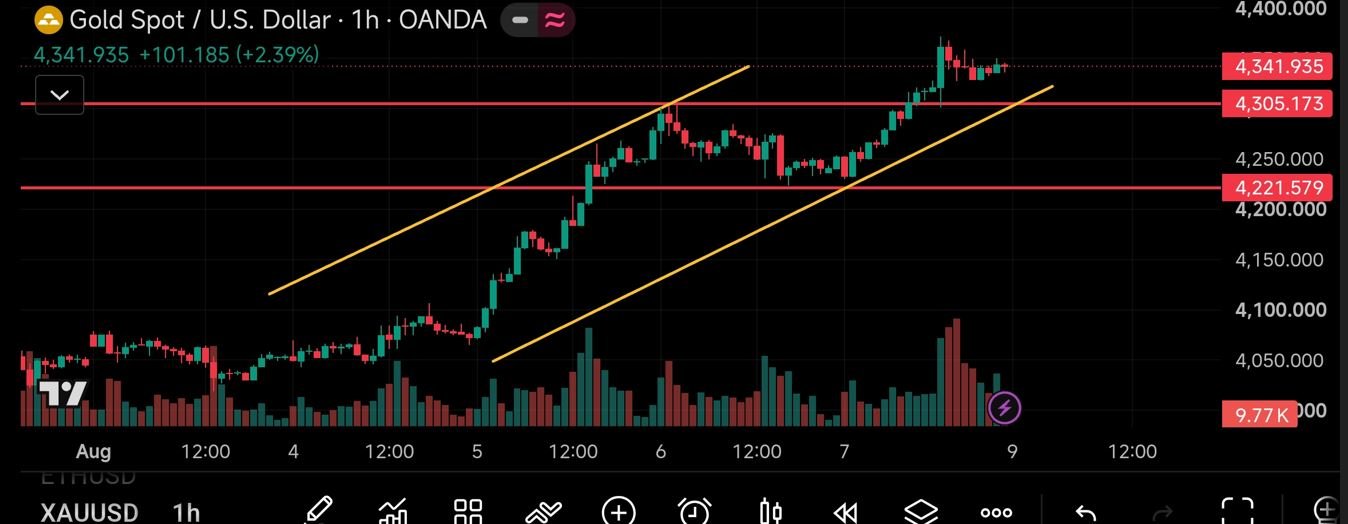
The critical development: price broke above 4,305 (1H close confirmed) and is holding above it. This is the most important structural event on the 1H chart. Prior resistance becoming support is not automatic — it must be confirmed by price behavior. The confirmation sequence: break → close above → retest → hold → continuation.
The 4,305 Flip — Why This Level Matters Most
A level flip — resistance becoming support, or support becoming resistance — is one of the highest-probability structural events in technical analysis. It occurs because traders who sold at resistance and were proven wrong (price broke through) now have open losses. When price returns to their entry level, they close their losing positions — creating buy pressure at exactly the level they previously sold. This is mechanical, not magical.
At 4,305, the flip scenario unfolds as: traders shorted at 4,305 expecting resistance to hold → price broke through → those shorts are now underwater → price pulls back toward 4,305 → shorts close positions to cut losses (= buying pressure) → the buying pressure helps establish 4,305 as support. This is the structural mechanism behind retest-and-hold setups.
The confirmation you need: Price must actually retest 4,305 and show a bullish reaction — a wick rejection, a bullish engulfing candle, or a higher low formation above the level. Simply being above 4,305 is not confirmation. The retest-and-hold is the confirmation.
The Complete Strategy Framework
This strategy layers five sequential filters — each must pass before any trade is placed. The order matters: structure first, indicators second. EMA crossover alone is not a strategy. EMA crossover within aligned market structure IS a strategy.
Why Structure Before Indicators
An EMA crossover in a ranging market produces whipsaws. An EMA crossover in a trending market with aligned structure produces follow-through. The structure filter eliminates the majority of false signals before they reach the indicator stage. This is the single biggest improvement you can make to any indicator-based strategy: add a structural filter before the indicator fires.
Stop Loss — Structure-Based, Not Fixed
Fixed pip stops ignore market context. A 100-pip stop might be tight on gold during NFP and wide during Asian session. Structure-based stops place the SL below the most recent structural level: for longs, below the last higher low on H1 or below the key support zone (4,305 if price is above it). For shorts, above the last lower high. This ensures your stop is behind a level the market must break to invalidate your trade — not at an arbitrary pip count.
Trailing Stop — Intelligent, Not Aggressive
Don't immediately trail your stop behind every candle. XAUUSD volatility will stop you out of good trades. Instead: once price reaches +1R, move SL to breakeven + buffer. At +2R, begin trailing behind H1 swing structure — the most recent higher low for longs. This lets the trade breathe through normal gold volatility while protecting profits at structural milestones.
Bullish Setups — Pullback vs Breakout
With XAUUSD currently above 4,305 and the 4H trend bullish, two distinct long setups exist:
Setup A — Pullback to Support (Preferred)
Price pulls back toward 4,305 → holds above it → bullish reaction (wick rejection, engulfing, higher low forms) → EMA crossover confirms → RSI > 50 → enter long. This setup has the best risk-reward because the stop can be placed tightly below 4,305.
Setup B — Breakout Continuation
Price breaks above the recent swing high → 1H candle closes above it (not just a wick) → retests the broken level → holds → continuation candle → enter long. This setup requires patience — don't enter on the first spike. Wait for the close above, then the retest.
What to avoid: Buying at 4,342 after a significant expansion without a pullback. The risk-reward is poor — your stop must be wide (below 4,221 or 4,305 depending on structure) and your target is compressed against the recent highs. Wait for the market to come to you, or wait for a confirmed breakout. Don't chase.
The Bearish Scenario — When Support Fails
The bearish case becomes structurally valid only after 4,305 fails. The failure sequence must be confirmed:
Distinguish between: a temporary dip below 4,305 that quickly recovers (this is a liquidity sweep — bullish) vs a confirmed close below + rejection (this is structural failure — bearish). The difference is in the confirmation, not the break itself. Without the retest and rejection, shorting a sweep will put you on the wrong side of the next leg up.
Prop Firm Risk Parameters — Why 1% Beats 2%
The math is straightforward. With a 5% daily drawdown limit:
| Risk/Trade | After 1 Loss | After 2 Losses | After 3 Losses | Verdict |
|---|---|---|---|---|
| 0.50% | -0.50% | -1.00% | -1.50% | Safe |
| 0.75% | -0.75% | -1.50% | -2.25% | Safe |
| 1.00% | -1.00% | -2.00% | -3.00% | Viable |
| 1.50% | -1.50% | -3.00% | -4.50% | Risky |
| 2.00% | -2.00% | -4.00% | -6.00% | VIOLATION |
Three normal stop-loss hits at 2% risk = challenge failed. Not because the strategy is bad — because the risk parameter didn't account for normal statistical variance. At 1%, the same three losses are uncomfortable but survivable. The safety buffer at 0.5-0.75% is even wider. Prop firm challenges are pass/fail. Capital preservation is the objective. Returns come after passing.
Frequently Asked Questions
How do you analyze XAUUSD market structure?
4H chart establishes directional bias — is the sequence higher highs/higher lows (bullish) or lower highs/lower lows (bearish)? 1H chart provides entry precision — where is price relative to key structural levels? Identify the 3-zone decision map: above 4,305 = bullish, between 4,221-4,305 = corrective, below 4,221 = bearish. Trades are only valid when both timeframes agree on direction and price is at a structurally valid entry zone.
What are the key XAUUSD levels right now?
4,305 is the most important level — former resistance, now acting as potential support after being broken and held. 4,221 is major structural support from the prior consolidation zone — this is the floor of the current uptrend. 3,966 is a deeper structural level. These levels are dynamic — they shift as the market structure evolves. Always reassess at new swing points.
Why use 1% risk instead of 2% for prop firm challenges?
Three consecutive stop-outs at 2% risk = -6%, exceeding the standard 5% daily drawdown limit. At 1%, the same three losses = -3% — an uncomfortable day but the challenge continues. A 60% win-rate strategy will experience 3+ consecutive losses roughly once every 30-40 trades. The risk parameter must survive these statistical streaks. 0.5-1% provides that survival margin. 2% does not.
How do market structure and EMA crossover work together?
Structure is the filter. EMA crossover is the trigger. Never reverse this. First confirm 4H and H1 structure support the trade direction. Only then look for the crossover signal. A bullish EMA crossover in a bearish 4H structure is a trap — it will likely fail. A bullish crossover in an aligned bullish structure has structural support behind it. Add RSI > 50 for long confirmation (or < 50 for short) to filter weak crossovers.
What's better — pullback to support or breakout continuation?
Pullback to support (Setup A) offers better risk-reward because the stop can be placed tightly below the support level. Breakout continuation (Setup B) offers higher probability of immediate follow-through but typically requires wider stops. For prop firm challenges where drawdown is the primary constraint, Setup A is preferred — tight stops protect the daily limit. Both setups are valid when the structural conditions are met.
Build Your XAUUSD Trading System
This strategy is designed for automation — sequential filters, binary conditions, structure-based logic. Whether you want to backtest it, generate MQL5 code, or commission a custom EA with these exact rules and prop firm compliance built in — we build what you design.





