Pullback vs Retracement vs Reversal
Three words traders use interchangeably — and one exact structural test that separates them. Get this right and every other pullback decision becomes mechanical.
Here is the uncomfortable truth about pullback trading: the entry is the easy part. The hard part is knowing, while it is happening, whether the counter-move you are watching is a pullback you should buy, a retracement you should measure, or a reversal you should respect. Traders lose money on this distinction every day — not because they lack indicators, but because they never defined the test. This article defines it, then applies it to a worked example with exact numbers.
The Three Terms, Defined Operationally
| Term | What it is | What it answers |
|---|---|---|
| Retracement | A measurement of counter-trend travel: how far, as a fraction of the prior impulse (Fibonacci levels anchored to defined swings). | "How much has price given back?" |
| Pullback | A tradeable event: a counter-move that holds the trend's defining swing and resolves in the trend direction. | "Is the trend continuing from here?" |
| Reversal | A structural event: a close beyond the trend's defining swing followed by a new opposite sequence of highs and lows. | "Has the trend's structure actually failed?" |
The relationship between them is one-way: every pullback is a retracement that resolved; a reversal is a retracement that broke structure. The retracement is the raw material. The classification is what you do with it — and the classification is decided by structure, not depth, not indicators, not feeling.
Retracement — The Measurement (And Its Limits)
Retracement is Fibonacci arithmetic applied to two anchor points. The mechanics:
F(r) = H − r × (H − L), where H is the impulse high, L the impulse low, and r the retracement ratio (0.382, 0.5, 0.618 are the commonly watched levels). The two things that matter and are almost always left unstated:
- Anchor selection. Wicks or bodies? Both are used, but mixing them produces levels that match neither. State your convention and keep it. Our series uses wick-based anchors from confirmed pivots.
- Pivot confirmation. An anchor is a swing point — and a swing point is only knowable after it is confirmed. In our convention: a strict fractal pivot (high greater than the 3 bars on each side) confirmed 3 bars later. Measuring Fibonacci from an unconfirmed pivot is measuring from information you did not have.
What retracement does not tell you: whether the level will hold. The 61.8% level is not a floor; it is a price where traders watch for evidence. Price can bounce from 38.2%, slice through 61.8%, or reverse at 78.6%. The level organises your attention; structure provides the answer. That is why our Fibonacci pullback rules require a trigger and an invalidation in addition to the level — the level alone is a location, not a signal.
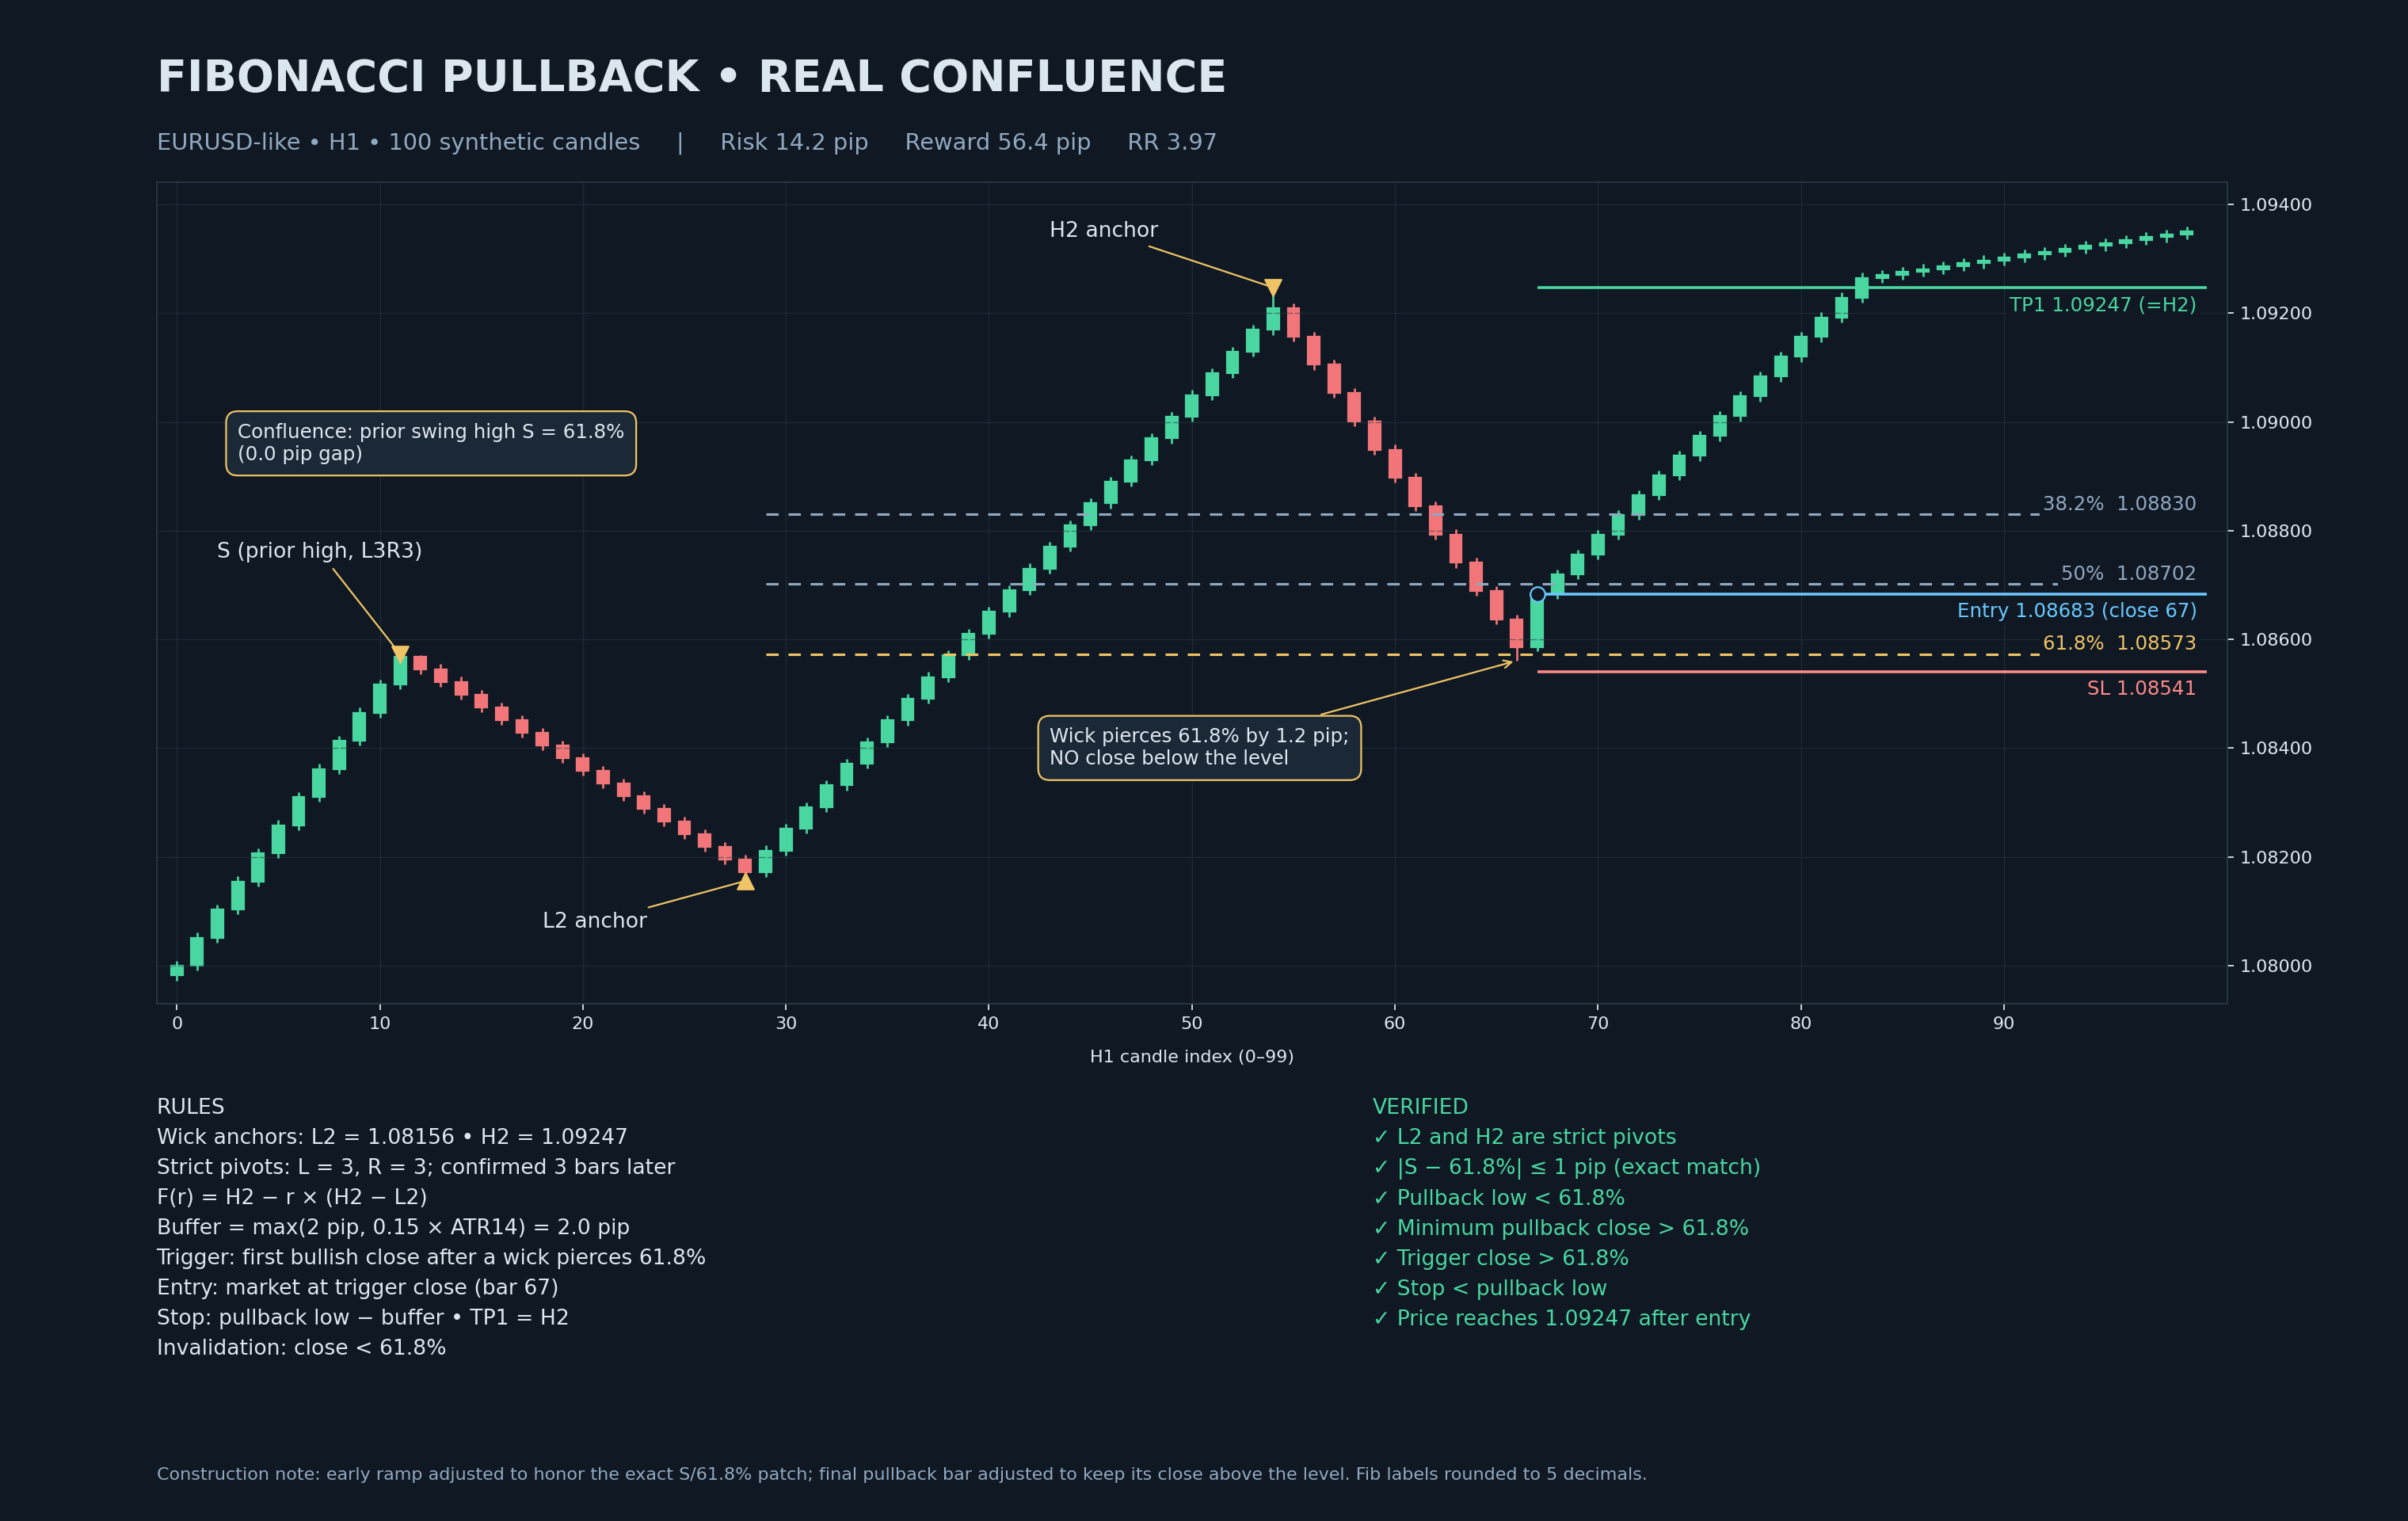
The verified example from our series: impulse anchors L2 = 1.08156 and H2 = 1.09247 put the 61.8% level at 1.08573. The pullback wick pierced the level by 1.2 pips — tolerance — but no close went below it. The first bullish close after the piercing bar (1.08683) was the trigger. Depth told us where; structure told us when.
Pullback — The Tradeable Event
A retracement becomes a tradeable pullback when three conditions are met, in this order:
- Trend context exists. Two or more confirmed higher highs and higher lows (uptrend), measured with the pivot convention above.
- The defining swing holds. The most recent confirmed higher low is not closed below. Wicks may pierce it — closes may not.
- The counter-move ends with a trigger. A defined candle behaviour — engulfing close, reclaim close, mini-structure break — that marks the resumption.
Notice that "the pullback reached my Fibonacci level" is not on the list. Levels are destinations; the list is structure. This ordering is deliberate: traders who invert it — level first, structure later — end up buying 61.8% retracements in trends that are already dead.
Reversal — The Structural Event
A reversal is not "a big counter-move". It is a sequence of two events:
Event 1 — the structure break (CHoCH). The first CLOSE beyond the trend's defining swing, against the trend direction. In an uptrend: a close below the most recent confirmed higher low. We call this the Change of Character because the market's behaviour has changed: it has done something it had not done during the entire trend — it has taken out a structural low.
Event 2 — the new sequence. After the break, the market builds an opposite structure: for a bearish reversal, a lower high followed by a lower low (or at minimum a sequence of lower highs). Until this sequence exists, the honest label is "broken structure, outcome unclassified" — the market may be reversing, or re-accumulating for continuation.
This two-event definition matters because it prevents the two classic errors: calling a reversal on a wick (Event 1 requires a close) and calling a reversal before the new sequence forms (the CHoCH alone is a warning, not a verdict).
Worked Example — Classifying a Counter-Move in Real Time
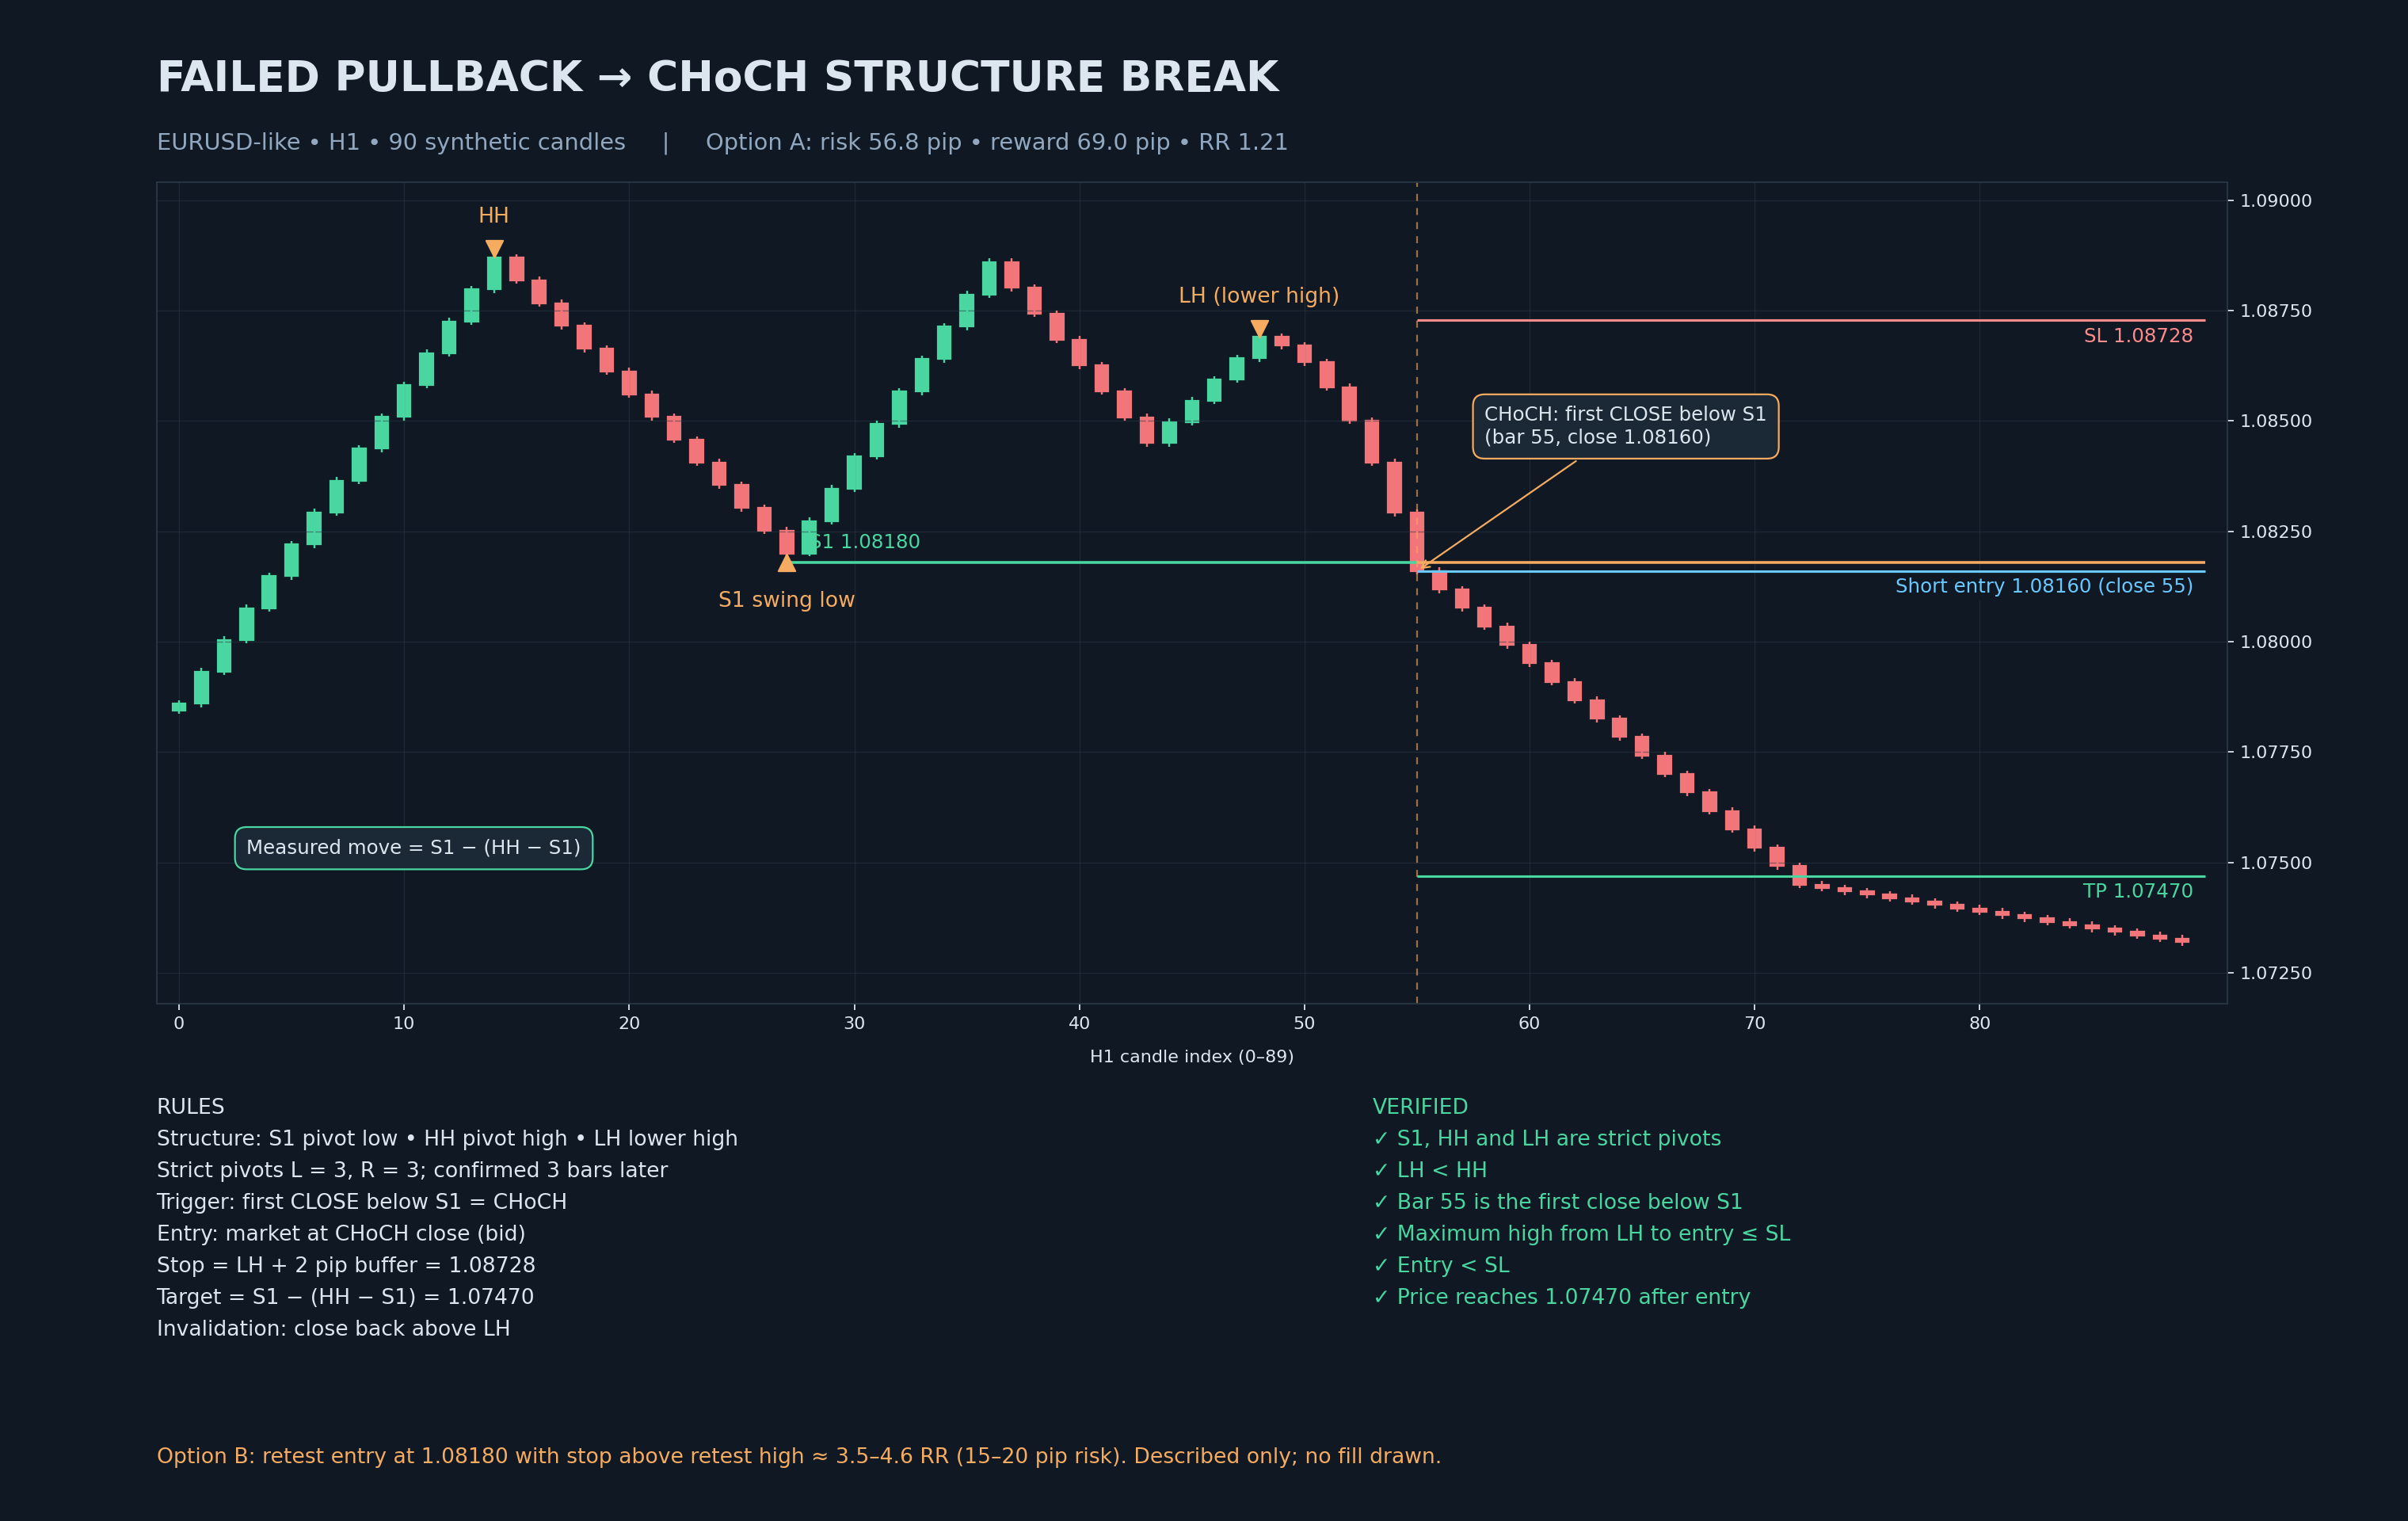
From the verified failed-pullback chart in this series (synthetic EURUSD-like H1 data). The trend sequence, with our pivot convention:
| Element | Value | Status |
|---|---|---|
| Confirmed swing low S1 | 1.08180 | The defining higher low of the uptrend |
| Confirmed swing high HH | 1.08890 | Higher high — uptrend intact |
| Confirmed lower high LH | 1.08708 | The pullback attempt fails to make a new high — first warning |
| CHoCH bar close | 1.08160 | First close below S1 → structure break confirmed |
Walk the classification through in the order the information arrived:
- After HH, the counter-move begins. Pullback logic applies — S1 is the defining level, and as long as closes stay above 1.08180, the default assumption is continuation.
- The bounce fails at LH (1.08708) instead of making a new high. This is the first behavioural warning: demand is weaker. Still not a reversal — lower highs happen inside pullbacks — but the setup quality has dropped, and a disciplined trader stops adding here.
- The decline closes at 1.08160, below S1. Event 1 fires. The trend's structure is broken. Whatever happens next, continuation logic is dead: the tradeable pullback has failed, and any remaining trend-following position should be exited per its invalidation rule.
- Event 2 (the new lower-high/lower-low sequence) is now the thing to watch. The measured-move target for a bearish resolution: \(\text{Target}=S_1-(HH-S_1)=1.08180-0.00710=\) 1.07470.
The two entry options at the CHoCH — with honest arithmetic
Option A — market entry at the CHoCH close. Entry 1.08160. Stop above the lower high plus the standard buffer: 1.08708 + 2 pips = 1.08728. Risk = 56.8 pips. Reward to the measured target (1.07470) = 69.0 pips. Reward-to-risk = 69.0 ÷ 56.8 = 1.21.
Option B — wait for the retest. Price often returns to the broken S1 (1.08180) from below before continuing. A limit entry at the retest with a stop above the retest high (a 15–20 pip risk in this example) produces a reward-to-risk in the 3.5–4.6 range — dramatically better geometry. The cost: the retest may never come, and the move leaves without you.
Depth Classification — What the Retracement Percentage Actually Tells You
| Depth | Zone | Typical implication |
|---|---|---|
| Shallow | 23.6%–38.2% | Strong trend; participants are not waiting for deep discounts. Entries must be armed early or missed. |
| Standard | 38.2%–61.8% | Healthy two-way flow; the classic pullback zone where most continuation setups resolve. |
| Deep | 61.8%–78.6%+ | Trend under pressure or volatility elevated. If structure holds, these are often the best risk-reward entries; if it fails, the reversal is usually violent. |
Read the table as probabilities shifting, not rules changing. Depth changes how you arm the setup (buffer width, patience) — the structural test for pullback vs reversal remains the same at every depth.
Behaviour Clues That Update the Odds
Between the levels and the structure break, four observable behaviours move the classification odds:
- Momentum symmetry. If the counter-move's candles are larger and faster than the trend's own candles, the counter-side is dominant — treat continuation as suspect. If the counter-move is slow and overlapping, it is a pause.
- Time symmetry. Pullbacks that consume more bars than the impulse took to form are usually corrections, not pullbacks.
- Liquidity behaviour at the level. A sweep that pierces an obvious low and closes back above it is continuation-friendly. A grind that closes through it is not.
- Overlap with the higher timeframe. If the "pullback" is actually the higher timeframe's trend direction, the odds invert. Check H4/D1 structure with the same pivot definition before every entry.
Trade Management by Classification
| Classification | What you do |
|---|---|
| Pullback (structure intact) | Arm the destination, demand the trigger, enter with the standard stop beyond the zone, hold to structure-derived targets. Add nothing until the trigger fires. |
| Ambiguous (lower high formed, defining level intact) | No new entries. Tighten management on existing positions (move stop to the pullback's structure, not to breakeven at random). Wait for either the trigger (resumption) or the CHoCH (failure). |
| Reversal (CHoCH close) | Exit trend-following positions — the premise is gone. Do not add, do not "give it room". New counter-trend entries only per a defined plan (Option A or B above), with stops above the lower high. |
The middle row is where most accounts are lost: traders treat an ambiguous structure as a pullback because they want the trade, then average down when it becomes a reversal. The table's whole purpose is to make the ambiguous state an explicit no-new-risk state.
Common Misclassifications and What They Cost
Treating a correction as a pullback. Buying the first bounce inside a multi-leg correction means buying into a structure that is still building its new sequence. Cost: repeated stop-outs in the same instrument.
Treating a wick as a break. Wick-based reactions to structure levels are sweeps, not failures. Exiting on wicks and entering on wicks systematically sells the exact low. Cost: paying the spread to be wrong twice.
Treating the CHoCH as a full reversal guarantee. The structure break says continuation is dead — it does not promise the reversal trade will work. Stops above the lower high exist precisely because some CHoCHs resolve into fresh accumulation. Cost: a defined, acceptable loss instead of an open-ended one.
Using depth as the test. "It pulled back 50% so it's a pullback" — depth is measurement, structure is truth. A 30% counter-move that closes below the defining low is a reversal wearing a pullback's clothes.
The Higher Timeframe Dimension — Classification Is Relative
Every classification is relative to a timeframe. This is not a philosophical footnote; it changes what you do. Consider a concrete nesting:
- H4: uptrend intact. The defining higher low (call it S4) has not been closed below. On H4, the current move down is — so far — a deep pullback.
- H1: the same move has already closed below its own defining higher low. On H1, the structure has broken. An H1 trend trader's continuation premise is dead; an H4 trend trader's premise is alive.
Both readings are correct at the same moment on the same instrument — because they describe different structures. The practical procedure that resolves the contradiction:
- Classify on the timeframe you trade — that classification governs entries and exits for your positions.
- Classify on the timeframe above — that classification governs whether new entries are allowed at all.
- When they conflict, reduce or skip. An H1 buy signal inside an H4 structure break is a counter-trend trade wearing a pullback label. It can work; it has a lower base rate; size it accordingly or stand aside.
This is why our Multi-Timeframe Pullback Alignment guide exists as a separate piece: the mechanics of stacking classifications without drowning in them. The one-line version: trade on one timeframe, permission from the one above, never the reverse.
The Three Signatures — What Each Outcome Looks Like in Candles
Abstract tests become usable when you can recognise their visual signatures in real time. Here is what each resolution looks like in candle terms:
Signature 1 — Pullback resolution
Ranges contract as price approaches the destination. The candle that reaches the zone is often small or wicky — sometimes piercing the level (a sweep) and closing back inside. The next one to three candles expand in the trend direction: larger bodies, small opposing wicks, closes near their extremes. The sequence of closes turns back in the trend's direction and never closes beyond the zone's far edge. Time symmetry usually holds: the counter-move takes fewer bars than the impulse it corrects. When you see this signature, the trigger has already fired; the trade is in or missed.
Signature 2 — The ambiguous coil
Price forms a lower high, then drifts around the defining level: overlapping candles, alternating colours, no close decisively beyond either the lower high or the defining low. This is the market deciding. The temptation is to "predict the resolution" — to buy early because the trend "should" continue. The discipline is the opposite: this signature is a no-new-risk state. You keep existing positions managed to their rules and you wait for either Signature 1 (trigger) or Signature 3 (CHoCH). The coil resolves within a handful of bars in most cases; patience costs nothing but time.
Signature 3 — Reversal confirmation
A lower high exists. A candle then closes beyond the defining low — and note the details that distinguish a real break from a sweep: the closing candle's body is meaningful (not a doji), and the move to the level was a grind of successive lower closes rather than one violent wick. After the break, the retest from below typically fails — price returns to the broken level and is rejected, printing a lower high relative to the retest. The new sequence (lower high, lower low) is then in place. By this point the reversal is not a prediction; it is a completed structure with a measurable target: the measured move S − (HH − S) applied to the broken level.
The Real-Time Classification Checklist
Six questions, answered in order, every time. If any answer is "no" or "not yet", the next question is not reached:
- Is there a confirmed trend structure? Two or more confirmed HH and HL (uptrend), pivots L=3/R=3 confirmed 3 bars later. No → there is no pullback concept here; the market is a range or a single leg.
- Is the defining level marked from a confirmed pivot? The most recent confirmed higher low, price value written down. No → mark it before doing anything else.
- Was the destination defined before price arrived? EMA, flipped level, Fibonacci zone, order block, flag boundary — chosen in advance. No → you are reacting, not planning; skip.
- Have closes held the defining level? Yes, and price reached the destination with a sweep or touch → pullback conditions live; continue. A close beyond the level → CHoCH; jump to question 6.
- Has the trigger fired? Engulfing close / reclaim close / mini-structure break in the trend direction. Yes → execute the pre-written plan (entry, stop, targets). No → wait; no position without the trigger.
- CHoCH path: is a new opposite sequence forming? Lower high after the break? Retest rejected? Measured target computable? The more of these exist, the more the reversal is a structure rather than a warning. Decide entry style (market at close vs retest limit) from your pre-written rules — not from the heat of the moment.
Print this checklist next to your screen for a month. The goal is that the classification stops being a judgment call and becomes a lookup — because judgment calls are exactly where the old version of you lost money.
FAQ
What is the difference between a pullback and a reversal?
Structure: a pullback holds the trend's defining swing level and resumes; a reversal closes beyond it (the CHoCH) and builds a new opposite sequence. The close-based break is the operational dividing line.
Is a retracement the same as a pullback?
A retracement is a measurement of counter-trend travel; a pullback is a retracement that held structure and resolved. Every pullback is a retracement; most retracements on a chart belong to something else.
How deep can a pullback go before it becomes a reversal?
Depth never defines it. 78.6% that holds the defining swing is still a pullback; 30% that closes beyond it is a structure break. The level is the test.
What is a CHoCH and why does it matter?
Change of Character: the first close beyond the defining swing against the trend. It is the earliest objective evidence that continuation has failed — the structural exit signal for trend positions.
Should I exit on the CHoCH or wait for a retest?
If you hold a trend position: exit on the CHoCH close — the premise is gone. Whether to enter the new direction is separate: market entry at the close guarantees participation with wider stops; a retest limit offers tighter stops with uncertain fills. Decide in advance.
Can a pullback become a reversal and then a pullback again?
Yes, and often. A structure break (CHoCH) can be followed by a reclaim of the broken level and a resumption of the original trend — a failed break, which is itself a classic setup. The discipline is to reclassify from scratch after every structural event instead of defending a label. The market owes your earlier opinion nothing.
What timeframe is best for classifying pullbacks and reversals?
The timeframe you execute on, plus one above for permission. Lower timeframes generate more structural breaks that are noise on the timeframe above — every M5 "reversal" is typically a single bar of an H1 pullback. If you trade fast timeframes, expect to reclassify frequently and size positions so that being wrong twice in a row is still affordable.
Continue the Series
- Pullback Trading Strategy — The Complete Guide (pillar)
- What Is a Pullback in Trading?
- Pullback or Reversal? How to Tell
- Failed Pullbacks — When Continuation Dies
- Deep Pullback vs Shallow Pullback
Structure Breaks, Scanned Live
The Institutional Flow dashboard tracks BOS and CHoCH across 50+ symbols and labels the resulting order plans with entries, stops and targets.
Go from article to implementation
Read the proof, then test the idea with calculators, free tools, case studies and a fixed-price build path.
Go deeper before you build, download or automate
Hand-picked engineering articles, indicator breakdowns and trading-system tools so visitors keep exploring instead of leaving after one page.

Pine Script to MT4/MT5 Conversion Planner
Analyze Pine strategies, repainting risk, TradingView alert bridges, MTF synchronization and the correct MQL4/MQL5 build path before paying for conversion.
Open planner
3-in-1 MT5 Indicator Bundle
12H Bias Engine, Smart Money Institutional Flow Dashboard and D1/H1 pending-signal logic with MQ5 + EX5 source included via Etsy.

MT5 Bank Orders Institutional Flow Dashboard
Supply/demand zones, BOS/CHoCH, liquidity levels, FVG, equal highs/lows and confirmed trade-plan logic explained with EX5 download.

MT5 Asia London NY Liquidity Engine
Asia range, London raid and New York continuation/reversal planning with internal session backtest stats and entry/SL/TP dashboard.

Interactive Brokers RSI Pair Trader
Tkinter desktop trading workflow, TWS API connection handling, RSI pair logic, risk controls and custom IBKR development positioning.

XAUUSD M30 CSV Data For Backtesting
Use clean MT5 historical data for Python backtests, strategy validation, spread checks and realistic gold EA research workflows.