Why Pullbacks Happen — The Market Mechanics
No conspiracy theories, no "the market maker wants your stop" mythology. Just the mechanical reasons a trend pauses — and the three practical rules those mechanics hand you.
A trend that moves in a straight line is not a strong trend; it is a data anomaly. Real markets breathe: impulse, pause, impulse. If you understand why the pause happens, the levels where it ends stop looking magical and start looking structural. This article walks through the actual mechanics — order flow, execution constraints, volatility cycles — and ends with the only three rules you need from any of it.
The Three Actors in Every Pullback
Every pullback is the net result of three groups acting on different horizons at the same time:
Actor 1 — The profit-taker
Short-term traders who rode the impulse exit into its strength. Their selling is not bearish conviction; it is position management. Many of them intend to re-enter lower. Their exits create the first wave of counter-pressure, and their re-entry limit orders become part of the demand that ends the pullback.
Actor 2 — The late participant
Traders who missed the initial move want a better price. Their limit orders sit at predictable levels — moving averages, previous resistance, Fibonacci zones — precisely because thousands of market participants watch the same levels. This clustering is self-reinforcing: the levels are watched because they have worked, and they work partly because they are watched.
Actor 3 — The large position
A position large enough to matter cannot be filled at one price without moving the market against itself. Filling size requires counterparties — resting orders to trade against. That need produces two observable behaviours: accumulation into weakness (which slows and ends pullbacks) and temporary pushes into liquidity clusters (which produce the overshoot wicks).
The key insight: none of the three actors requires the trend to end. All three operate because the trend exists. That is why pullbacks are the norm in healthy trends and their absence is the anomaly.
The Execution Layer — Why Price Must Travel to Liquidity
To understand pullback depth, you need one fact about how orders work: a market order consumes resting orders (liquidity) until it is filled; a limit order provides liquidity. Large market orders therefore leave footprints — they travel price through zones where resting orders are thin, and they stop where resting orders are dense.
Resting orders are not distributed uniformly. They cluster at:
- Obvious levels: round numbers, previous session highs/lows, the previous day's high and low, weekly opens.
- Technical levels: moving averages that many systems reference, prior support/resistance, Fibonacci levels.
- Stop clusters: just beyond equal highs/lows, just beyond the low of a pullback, just beyond round numbers. Stops are market orders waiting to happen.
A pullback that "overshoots by a few pips and reverses" is not malice — it is a market order consuming the stop cluster beyond the level, filling against it, and then finding no further sellers. The wick is the receipt. This single mechanism explains why close-based invalidation beats wick-based invalidation, and why our standard buffer scales with ATR instead of using a fixed pip count: sweep depth scales with volatility.
Volatility Cycles and Pullback Depth
Pullback depth in absolute terms (pips) is governed largely by the volatility regime. When ATR is expanding, counter-moves travel further; when ATR is contracting, they are compressed. This is why a "normal" pullback on EURUSD might be 15 pips in one month and 45 pips in another — the structure is identical; the regime is not.
This is the reason our series uses an ATR-scaled stop buffer: \(\max(2\text{ pips},\;0.15\times\text{ATR}_{14})\). The table shows how the same rule adapts across instruments:
| Instrument (H1) | Typical ATR14 | Buffer = max(2, 0.15×ATR) |
|---|---|---|
| EURUSD | ~12 pips | 2.0 pips (the floor applies: 0.15×12 = 1.8) |
| GBPJPY | ~38 pips | 5.7 pips |
| XAUUSD (gold) | ~45 pips | 6.75 pips |
| NAS100 | ~90 pips | 13.5 pips |
A fixed "3 pip buffer" is generous on EURUSD and suicidal on gold. The mechanics of sweeps do not care about your habits; they care about how far a market order must travel to find the next cluster. Scale with the regime or be scaled by it.
The Stop Cluster Layer — Sweeps Without the Mythology
The popular story says "institutions hunt your stop." The mechanical version is more useful and less paranoid: your stop is one of thousands of market orders resting just beyond an obvious level. Any participant needing liquidity knows that cluster exists. Whether the motivation is a deliberate raid or simply a large order consuming everything on its path, the observable result is identical: a wick through the level, then a reversal when the cluster is exhausted.
Three practical consequences follow, and they are the same three rules every guide in this series applies:
- Define levels, not emotions. The levels where clusters sit are visible to everyone — equal highs/lows, session extremes, pullback lows. Those are the levels your zones and stops must respect.
- Allow the wick, demand the close. Sweeps pierce; breaks close. Invalidation rules built on closes survive both stop runs and genuine breaks; wick-based rules get harvested by the former.
- Let the sweep be information. A pullback that sweeps an obvious cluster and closes back inside it has cleared the fuel on that side. These setups are frequently higher quality than polite touches — the liquidity sweep as pullback is a full model in this series.
The Anatomy of a Pullback, Bar by Bar
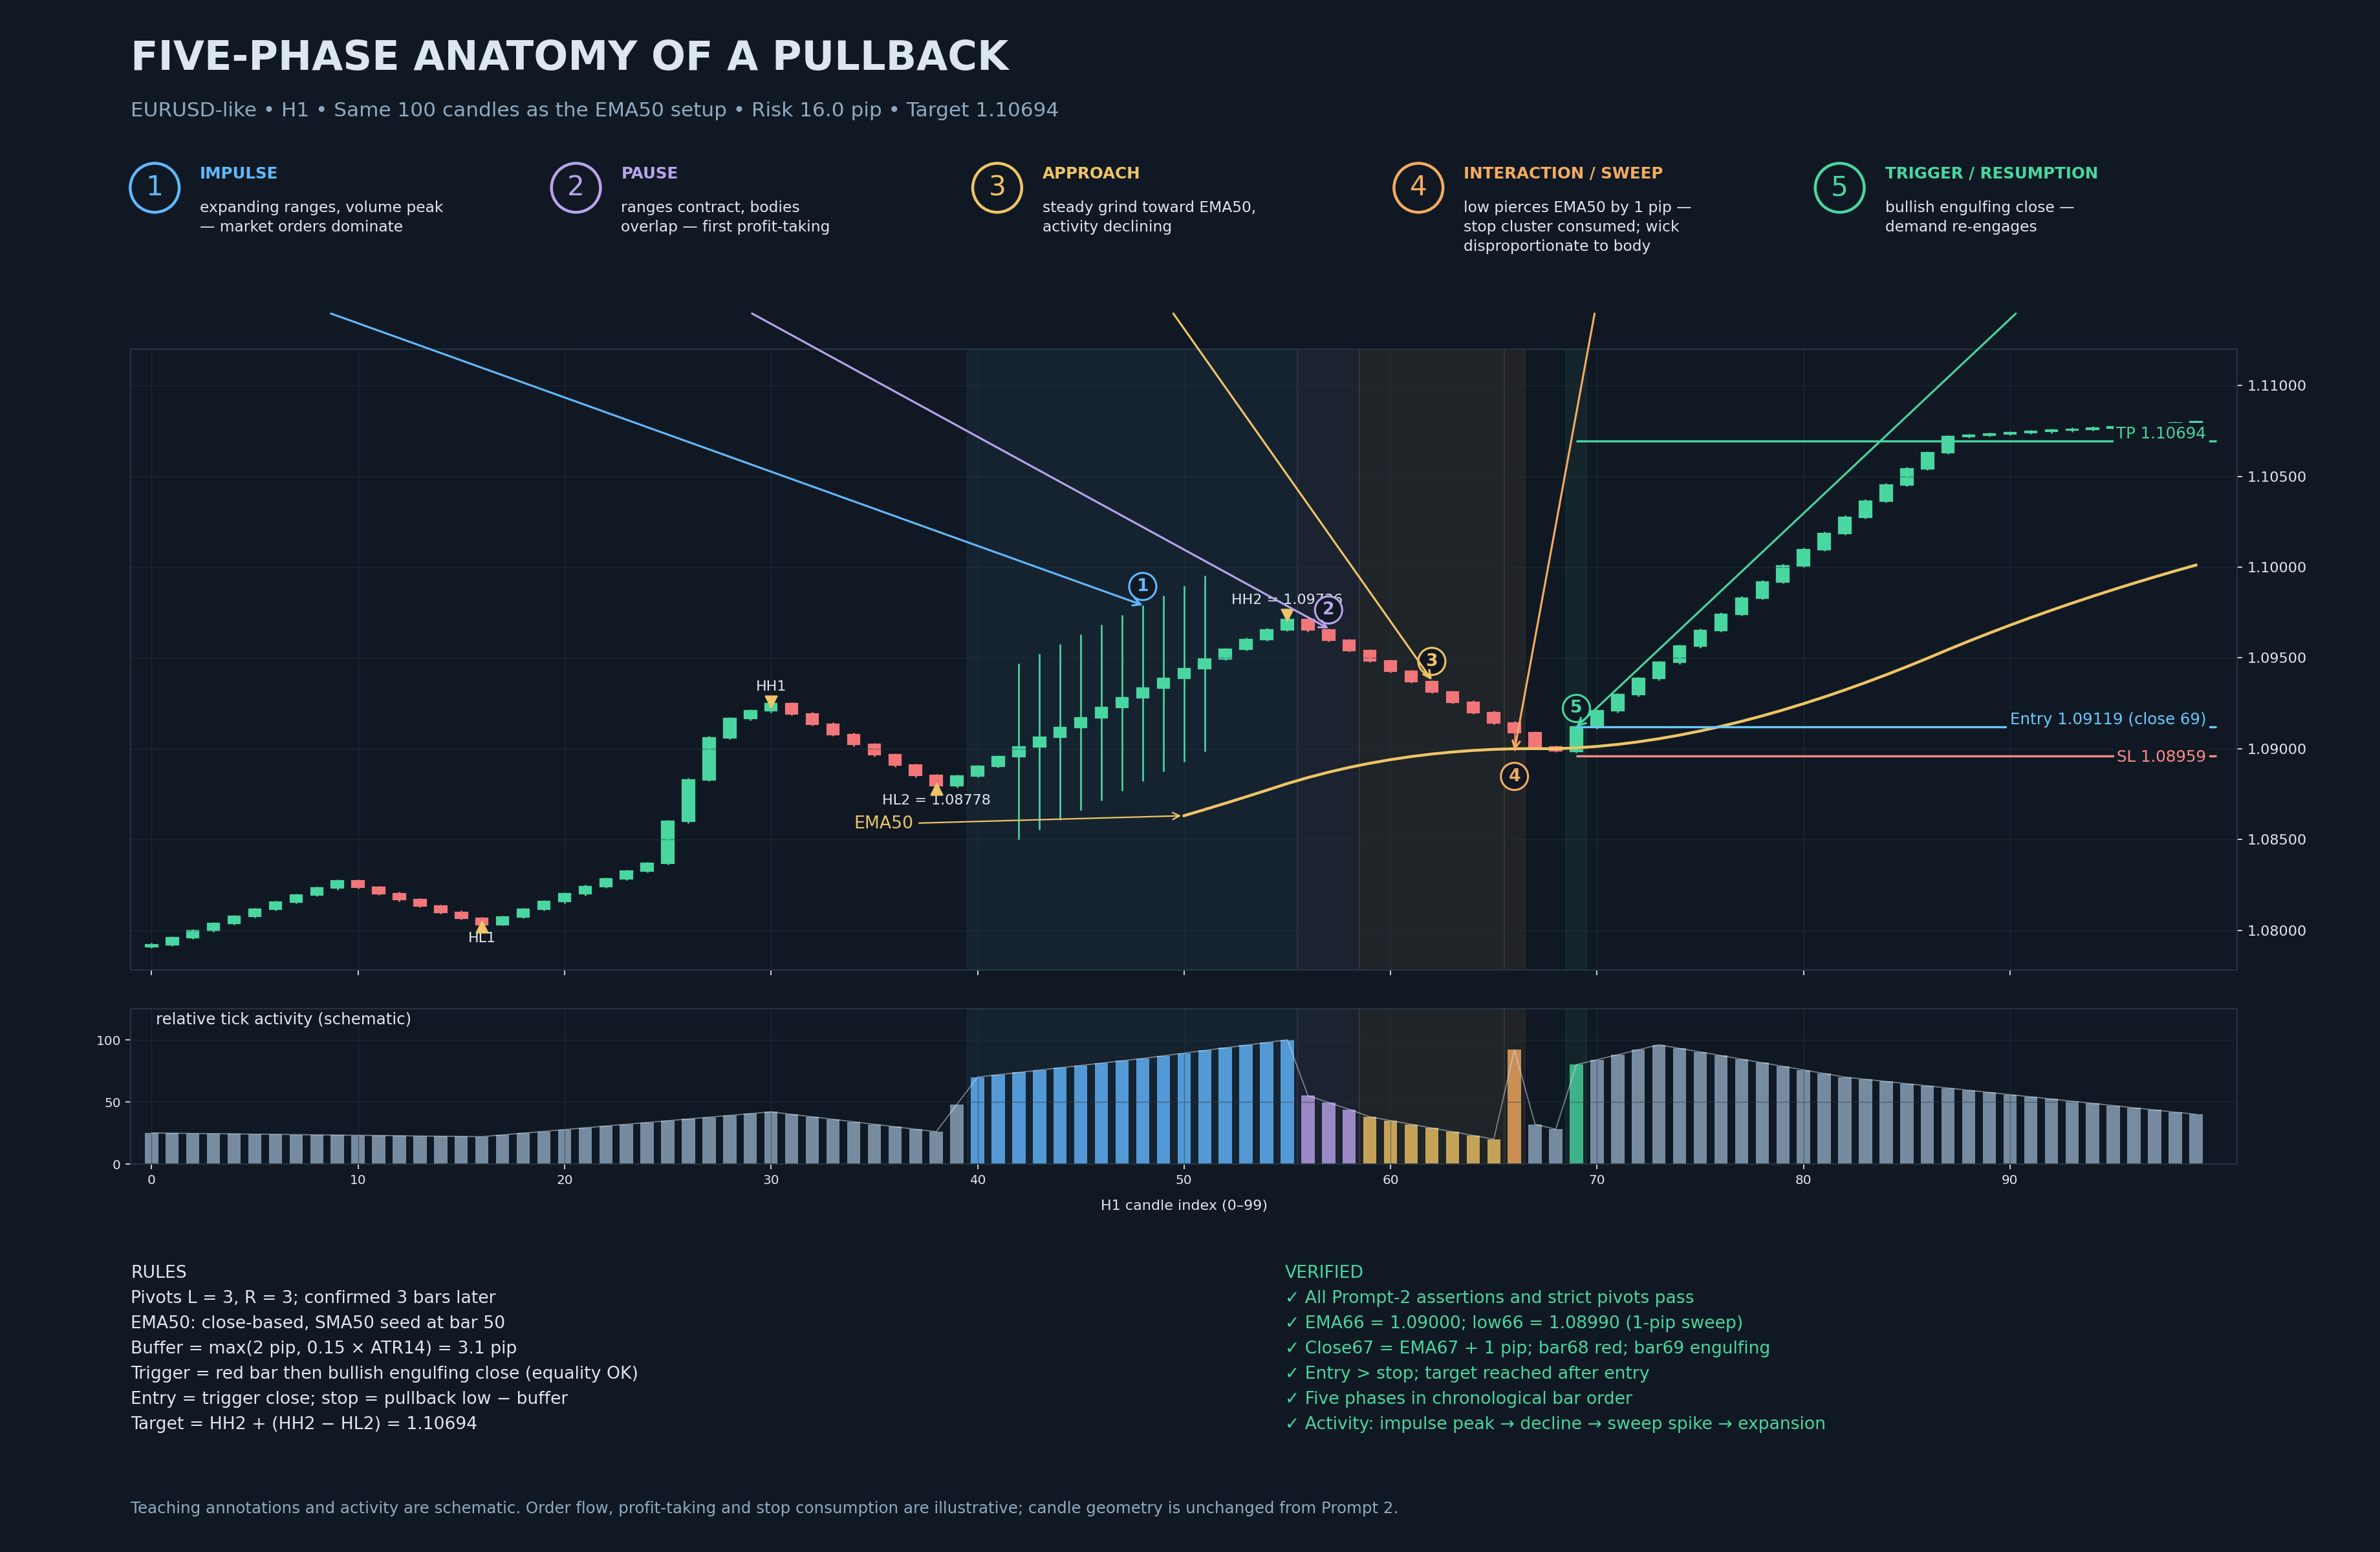
The cleanest way to internalise the mechanics is to follow a single pullback through its five phases and read the observable signatures of each. The signatures are what you actually trade against; the phases are the explanation.
Phase 1 — The impulse
The trend's latest leg launches. In order-flow terms, market orders overwhelm the resting liquidity on one side: bids are consumed above the prior swing, stops of counter-trend traders are triggered (they are market orders too), and price accelerates. Observable signatures: expanding candle ranges, tick volume well above the recent average, small opposing wicks (sellers are being run over, not absorbed). You do not enter here — you are late by definition — but this phase defines everything that follows: the impulse's range becomes the measuring stick for the retracement, and its origin becomes the zone that future pullbacks will target.
Phase 2 — The first pause
The acceleration stops. The first bars against the trend are usually small: some profit-taking meets some continuation buying, and the net move is modest. Observable signatures: candle ranges shrink relative to the impulse, bodies overlap, tick volume drops from the impulse peak but is not yet low. This phase is where the pullback becomes visible but not yet tradeable — no destination has been reached, no trigger exists. The discipline demanded here is simply waiting.
Phase 3 — The approach
Price travels toward the destination — the moving average, the flipped level, the Fibonacci zone, the order block. Mechanically, this is the late-participant flow being serviced: limit orders at the destination are the counterparty that lets price keep moving without collapsing. Observable signatures: a steady grind of overlapping candles, declining tick volume (fewer participants care at these prices), narrowing spread of closes. If instead the approach candles are expanding — large bodies, volume climbing — the character has changed: this is not a pullback approaching a zone; it is a counter-trend move gathering strength. That distinction, visible only in the candles, is the earliest available warning.
Phase 4 — The interaction (and the sweep)
Price reaches the destination. What happens in the next one to three bars is the entire ballgame. Two versions exist:
- The polite touch: price touches the zone, finds immediate bids (or offers), and turns without piercing. Efficient, but rare in liquid markets — because the stop clusters sitting just beyond the zone are too attractive to the orders that need liquidity.
- The sweep: price pierces the zone's far edge, consumes the stop cluster (those stops are market orders now filling the resting orders of whoever wanted the other side), and closes back inside. The wick is the receipt for the consumed liquidity. This version is more common and, handled with close-based invalidation, more tradeable — the sweep has removed the fuel on that side.
Observable signatures of a sweep-versus-break: a sweep shows a wick disproportionate to the candle body, a close back on the trend side of the level, and tick volume spiking on the wick bar then dropping immediately. A genuine break shows a full-body close beyond the level and volume that stays elevated as the next bars follow through.
Phase 5 — The trigger and resumption
The counter-move ends with a defined candle event — in our models, a bullish engulfing close, a reclaim close above the zone, or a close beyond the pullback's own mini-structure. Mechanically, this is demand re-engaging with visible force: the resting orders at the destination are now joined by market orders, and the trend's original impulse flow resumes. Observable signatures: expanding range in the trend direction, close near the bar's extreme, volume expansion after the pullback's contraction. This is the bar where the entry lives, and it is the only bar in the sequence you are allowed to act on without a plan violation.
Read the five phases once on any live chart and the pattern becomes hard to unsee. The value is not descriptive — it is that each phase has a defined absence of action: no entry in phases 1–4, one defined action in phase 5. Most pullback losses come from compressing the sequence — entering during phase 3 because the destination "looks certain", which is precisely the moment the market has not yet finished its job.
Reflexivity — Why the Same Levels Keep Working
A fair objection at this point: moving averages and Fibonacci levels are arbitrary — why should price respect a 50-period average or a 61.8% ratio any more than any other number? The mechanical answer is reflexivity: the levels work in part because participants watch them, and participants watch them because they have worked.
Walk through the loop once. A level gains attention (it marked a swing, it aligns with an average). Systems and manual traders place orders there. Price reacts there (the orders get filled, the reaction is visible). The reaction reinforces the level's reputation. More orders are placed the next time. The loop is self-sustaining for as long as the participants who believe in it remain the marginal flow. Nothing about the number itself is sacred — the cluster of orders it accumulates is real, and clusters of orders are what move prices at the margin.
This has three consequences for pullback traders:
- Levels are probabilistic, not mechanical. A Fibonacci zone is not a floor; it is a location where, on average, a meaningful share of resting orders sits. It changes the odds; structure decides the outcome. This is why every model in this series pairs the level with a trigger and an invalidation.
- Reflexivity can break. When the regime changes — a central-bank shock, a volatility explosion, a crowded trade unwinding — the old levels are overrun because the flow that respected them has been displaced by flow that does not. The tell is behavioural: levels being sliced through with full bodies and no reactions, repeatedly. When that happens, stand down and let a new structure form; do not keep feeding a loop that has stopped running.
- Popularity cuts both ways. Heavily watched levels are precisely where sweeps are deepest, because that is where the most stops cluster. The reflexivity that makes a level "work" also makes its immediate surroundings the most contested few pips on the chart. Allow the wick; demand the close.
Case Study — Reading the Mechanics on the Verified EMA Chart
The verified EMA pullback chart in this series (synthetic EURUSD-like H1 data) is a clean five-phase sequence, and the numbers make the mechanics concrete:
- Impulse (phases 1): the trend leg runs to the swing high at 1.09736 (HH2), expanding range into the peak — the signature of market-order dominance.
- Pause and approach (phases 2–3): twelve bars of overlapping, declining-range candles walk price back toward the rising EMA50. No single bar against the trend is larger than the impulse bars — the character stays "pause", not "reversal".
- Interaction (phase 4): the pullback low pierces the EMA50 by exactly 1 pip — a minimal sweep of the cluster sitting just under the average — and the close stays within 2 pips of the EMA. Close-based invalidation is never threatened; wick-based invalidation would have been harvested.
- Trigger (phase 5): a red bar followed by a bullish engulfing close (open at or below the red close, close at or above the red open). The trigger is evaluated on the close — knowable in real time, no look-ahead.
- Resumption: the entry sits at the trigger close (1.09119), the stop at the pullback low minus the ATR-scaled buffer (1.08959 — 16.0 pips of risk), and the trend resumes to the measured target.
Notice what the mechanics account contributed: it explains why the one-pip pierce should be expected rather than feared (stop cluster under the average), why the buffer must sit beyond the wick (sweep depth), and why the trigger must be close-based (the sweep's job is done at the close, not during it). None of that required knowing anyone's intent.
Time-of-Day Effects — When Pullbacks Form and Resolve
Pullbacks are not uniformly distributed through the day. The same mechanics produce predictable timing patterns:
- Session opens (London, New York): volume and volatility spike, impulses launch, and the first pullback of the session forms within the first hour. Many traders build their entire day around the first London pullback and the New York morning retracement.
- Session midpoints: the lull between London and New York (roughly the European lunch) is where pullbacks drift, overlap and stall — low liquidity means the pullback can travel further on less volume, and triggers fired here are lower quality because spreads widen exactly when your stop is nearest.
- Session closes: position squaring creates counter-flows near the fix and the close, and the following session frequently opens by retracing the last move — the gap-pullback of Type 3 in our taxonomy.
Our session clock maps the windows per instrument. The practical rule: prefer pullback triggers during your instrument's two highest-liquidity sessions; treat triggers fired in the lull as suspect until the next session confirms them.
Why This Mechanics Lesson Matters — The Three Rules
Everything above reduces to three operational rules that appear in every pullback model in this series:
- Locations are predictable; outcomes are not. Order clusters make pullback destinations definable in advance (averages, flipped levels, Fibonacci zones, order blocks, flag boundaries). Whether the destination holds is decided by structure — a trigger and an invalidation — not by the location itself.
- Depth is regime-dependent; test accordingly. Buffers, stop distances and even which pullbacks are reachable all scale with ATR. Any rule using fixed pip distances will behave differently in the next volatility regime than in the one you tested on.
- The counter-move is fuel management, not opinion. Profit-taking, late entries and position filling are flows that use the pullback. Your job is not to explain them but to be positioned where they finish — with the wick tolerated and the close respected.
Putting It to Work Tomorrow
Mechanics are only useful when they change tomorrow's behaviour. Three concrete habits follow directly from everything above:
Write destinations before the session opens. Pick your instrument, mark the moving average value, the last flipped level, the Fibonacci band of the current impulse and the nearest order block — before any price arrives. The mechanics say the destination is the predictable part; the discipline is making that prediction explicit while it is still cheap to be honest about it.
Log the regime with every trade. Record the ATR14 at entry alongside the result. After fifty trades you will see your pullback statistics split by volatility regime — and you will likely discover the strategy's edge is concentrated in one or two regimes. That is not a flaw of the strategy; it is the mechanics showing up in your data.
Grade the sweeps. For each pullback entry, note whether the zone was touched politely or swept, and how deep the pierce was in ATR terms. If your instrument sweeps consistently, your buffer is not wide enough — and your data, not an article, will tell you the number.
FAQ
Why do markets pull back if the trend is strong?
Because order flow is never one-directional. Profit-taking, late entries and large-position execution all operate inside the trend — the pullback is their intersection, not a sign of trend failure.
Do stop hunts cause pullbacks?
Stops are resting market orders clustered at predictable levels; anyone needing liquidity can transact against them. The wick beyond an obvious level is observable; the intent is not — and your rules should not depend on it.
Why do strong trends have shallow pullbacks?
Urgency. When missing the move hurts more than overpaying, participants buy minor dips and the retracement never travels far. Shallow pullbacks are a symptom of demand pressure.
What determines how deep a pullback goes?
Trend urgency, the volatility regime (ATR expansion deepens counter-moves) and the location of resting liquidity clusters. Depth is information about conditions, not a fixed rule.
Can you predict where a pullback will end?
You cannot predict — you can predefine the levels where it is most likely to end: moving averages, broken levels, Fibonacci zones, order blocks and liquidity pools. Location and probability, not certainty.
Does volume confirm a healthy pullback?
As a signature, yes — with the standard caveat that forex "volume" is tick activity, not exchange volume. The usable pattern is relative: activity expands on the impulse, contracts through the pullback, and expands again on the trigger. A pullback whose approach shows rising activity is a counter-trend move gathering strength, and should be treated as suspect regardless of how perfect the destination looks.
Continue the Series
- Pullback Trading Strategy — The Complete Guide (pillar)
- What Is a Pullback in Trading?
- Liquidity Sweeps as Pullbacks
- ATR-Based Stops and Targets
- Pullback or Reversal? How to Tell
See Liquidity Mechanics Scanned Live
The Institutional Flow dashboard tracks liquidity levels, sweeps and structure breaks across 50+ symbols — the mechanics of this article, running live.
Go from article to implementation
Read the proof, then test the idea with calculators, free tools, case studies and a fixed-price build path.
Go deeper before you build, download or automate
Hand-picked engineering articles, indicator breakdowns and trading-system tools so visitors keep exploring instead of leaving after one page.

Pine Script to MT4/MT5 Conversion Planner
Analyze Pine strategies, repainting risk, TradingView alert bridges, MTF synchronization and the correct MQL4/MQL5 build path before paying for conversion.
Open planner
3-in-1 MT5 Indicator Bundle
12H Bias Engine, Smart Money Institutional Flow Dashboard and D1/H1 pending-signal logic with MQ5 + EX5 source included via Etsy.

MT5 Bank Orders Institutional Flow Dashboard
Supply/demand zones, BOS/CHoCH, liquidity levels, FVG, equal highs/lows and confirmed trade-plan logic explained with EX5 download.

MT5 Asia London NY Liquidity Engine
Asia range, London raid and New York continuation/reversal planning with internal session backtest stats and entry/SL/TP dashboard.

Interactive Brokers RSI Pair Trader
Tkinter desktop trading workflow, TWS API connection handling, RSI pair logic, risk controls and custom IBKR development positioning.

XAUUSD M30 CSV Data For Backtesting
Use clean MT5 historical data for Python backtests, strategy validation, spread checks and realistic gold EA research workflows.