Pullback Trading Strategy — The Complete Guide
Every rule in this guide is written as an exact, testable condition: defined pivots, defined zones, defined triggers, defined invalidation. No vague "buy near support" instructions — and no fabricated win rates.
Pullback trading is the craft of entering an established trend when it pauses. Instead of chasing breakouts, you wait for price to retrace into an area where the original move likely left unfilled orders — a moving average, a broken level, a Fibonacci zone, an order block — and you enter when the pause shows signs of ending. Done with discipline, pullback entries offer tighter stops and better reward-to-risk than breakout entries. Done carelessly, they are how traders buy the exact top of a correction that never ends.
This guide gives you the complete framework: the mechanics behind pullbacks, how to distinguish a pullback from a reversal, five entry models with exact rules, where to put the stop, how to derive targets, how to size positions, how to test the strategy honestly, and the failure modes that quietly destroy pullback accounts. It is the pillar of our full pullback trading series of 40 guides.
1. What a Pullback Actually Is
A pullback is a temporary counter-trend move inside an established trend. Three conditions define it precisely:
- There is a trend to pull back from. In practice this means a visible sequence of higher highs and higher lows (uptrend) or lower highs and lower lows (downtrend), measured with defined swing points — not "it looks bullish".
- The counter-move is limited in structure. The retracement does not break the structural low (uptrend) that defines the trend. While that low holds, the trend is technically intact.
- The trend resumes. This is what makes it a pullback rather than the start of a reversal — and it is only known afterwards. That single fact is why every pullback trade needs a pre-defined invalidation rule.
Why pullbacks exist — the mechanics
Markets do not move in straight lines because order flow is not one-directional. Three forces create pullbacks:
Profit-taking. Traders who bought the impulse take profit into strength, creating temporary sell pressure that has nothing to do with a change of trend.
New participants entering late. Traders who missed the initial move want a better price. Their resting limit orders sit at predictable levels — moving averages, previous resistance, Fibonacci zones — and price is drawn toward that liquidity before continuing.
Institutional accumulation and distribution. Large positions cannot be filled at one price. A trend pause allows size to be accumulated without moving the market further. The zones where this activity leaves its footprint — order blocks, imbalance gaps — are the areas where pullbacks most often end.
None of this requires a belief in market conspiracies. It is simply the mechanical result of a market where different participants operate on different horizons: short-term traders exit into strength, longer-term traders accumulate into weakness. The pullback is the visible intersection of those flows.
2. Pullback vs Retracement vs Reversal — Precise Definitions
These three words are used loosely, which creates real trading errors. Here is how we use them, and the operational difference between each:
| Term | Definition | Structural test |
|---|---|---|
| Pullback | Counter-trend move that holds the trend's defining structure and resolves in the trend direction. | The structural swing low (in an uptrend) is NOT closed below. |
| Retracement | Any counter-trend move measured as a fraction of the prior impulse (usually with Fibonacci levels). | Measurement term — says nothing about whether the trend survives. |
| Reversal | A counter-move that breaks the trend's defining structure and establishes a new opposite sequence (e.g. a lower low after a series of higher lows). | The structural swing low IS closed below, and a new lower-high/lower-low sequence follows. |
The practical consequence: a retracement is what you measure, a pullback is what you trade, and a reversal is what you must be able to recognize while it is happening — because that is when your stop is supposed to take you out. The entire safety of pullback trading rests on one rule: the trend's structural level is your invalidation line, and it is defined before you enter, not after.
We cover the full identification procedure in Pullback vs Retracement vs Reversal and How to Tell a Pullback From a Reversal.
3. The Anatomy of a High-Quality Pullback
Not all pullbacks deserve a trade. Five ingredients separate the A-setups from the noise:
3.1 Trend quality
The trend should be made of confirmed swing points in sequence. Our working definition throughout this series: a swing high is a bar whose high is strictly greater than the highs of the 3 bars before and after it (and mirrored for swing lows). Such a pivot is only confirmed 3 bars later — using it earlier is look-ahead bias. A trend with at least two confirmed higher highs and two confirmed higher lows is a trend you can pullback-trade. A single impulsive leg with no structure is not a trend; it is a move.
3.2 A defined destination for the pullback
Good pullbacks travel to a level where you can place a rational entry and a rational stop: a rising moving average, a broken resistance now acting as support, a Fibonacci zone anchored to real swing points, a demand order block, or a flag boundary. "Somewhere around here" is not a destination. The level must be defined before price arrives — that is what makes the entry a plan rather than a reaction.
3.3 Momentum behaviour into the level
Compare two pullbacks: one drifts into the zone with shrinking candles and overlapping bodies; the other crashes into it with consecutive large bearish candles. The first is a pause. The second is a warning that sellers have taken control. Shrinking range and volume into the pullback zone is the signature of a healthy pause; expanding range against the trend suggests the move may be a reversal in progress.
3.4 A trigger
You do not enter because price touched a level. You enter because price reached the level and then produced a defined trigger in the trend direction: an engulfing close, a reclaim close above the zone, a break of the pullback's own mini-structure. The trigger converts a touch into evidence. Every model in Section 5 has its trigger written as an exact Boolean condition.
3.5 Agreement with the higher timeframe
A pullback on H1 inside an H4/D1 downtrend is not a pullback you want to buy. Before taking any pullback, check the higher timeframe's structure with the same pivot definition. If H4 and D1 are trending down, an H1 "uptrend pullback" is more likely an H4 pullback rally — a selling opportunity, not a buying one. See Multi-Timeframe Pullback Alignment.
4. The Exact Rules Framework
This is the specification layer that makes a pullback strategy testable. We use these conventions in every guide in this series, and they are the same conventions our MT5 tools use internally:
Working conventions
- Pivots: strict fractal, 3 bars left / 3 bars right (L=3, R=3). Confirmed 3 bars after the pivot bar. A pivot is never used in a signal before its confirmation bar closes.
- Trend: two or more confirmed higher highs AND higher lows for an uptrend (mirrored for downtrend).
- Stop buffer: max(2 pips, 0.15 × ATR14). ATR-normalized so the buffer scales with volatility instead of a fixed pip count.
- Trigger: evaluated on candle CLOSE only. No intrabar assumptions.
- Entry: market at the close of the trigger bar (long at ask, short at bid) — or a limit order at a defined level with a defined expiry; the article always states which.
- Invalidation: close-based. A wick beyond a level is tolerance; a close beyond it is a failure.
- Targets: structure-derived — a prior confirmed pivot, or a measured move whose anchors are stated. "Fixed 100 pips" is not a target rule.
- Costs: spread, commission and swap are excluded from illustrations and MUST be included in any real test.
Two consequences deserve emphasis because they are the most common sources of fake results:
No look-ahead. When you manually review a chart and mark the perfect pullback low, you are using information — the bars that came after — that was not available in real time. A pivot low is knowable only 3 bars after it forms; the trend resumption is knowable only when it happens. Any backtest that "enters at the low" is fiction unless the entry rule could have fired at that moment with the data then available.
Quote sides and costs. A long enters at the ask and exits at the bid. On EURUSD with a 1.0 pip spread, a trade with a 20-pip stop and 40-pip target pays roughly 1 pip per side of the round trip — that is about 5% of the gross reward on a 2:1 setup, before commission. On M5 charts with 10-pip stops, the same spread consumes 20% of the risk budget. This is why pullback strategies are far more robust on H1 and above.
5. The Five Pullback Entry Models
Each model below is complete enough to test as written. The full dedicated guide for each is linked.
5.1 EMA pullback (trend + moving average)
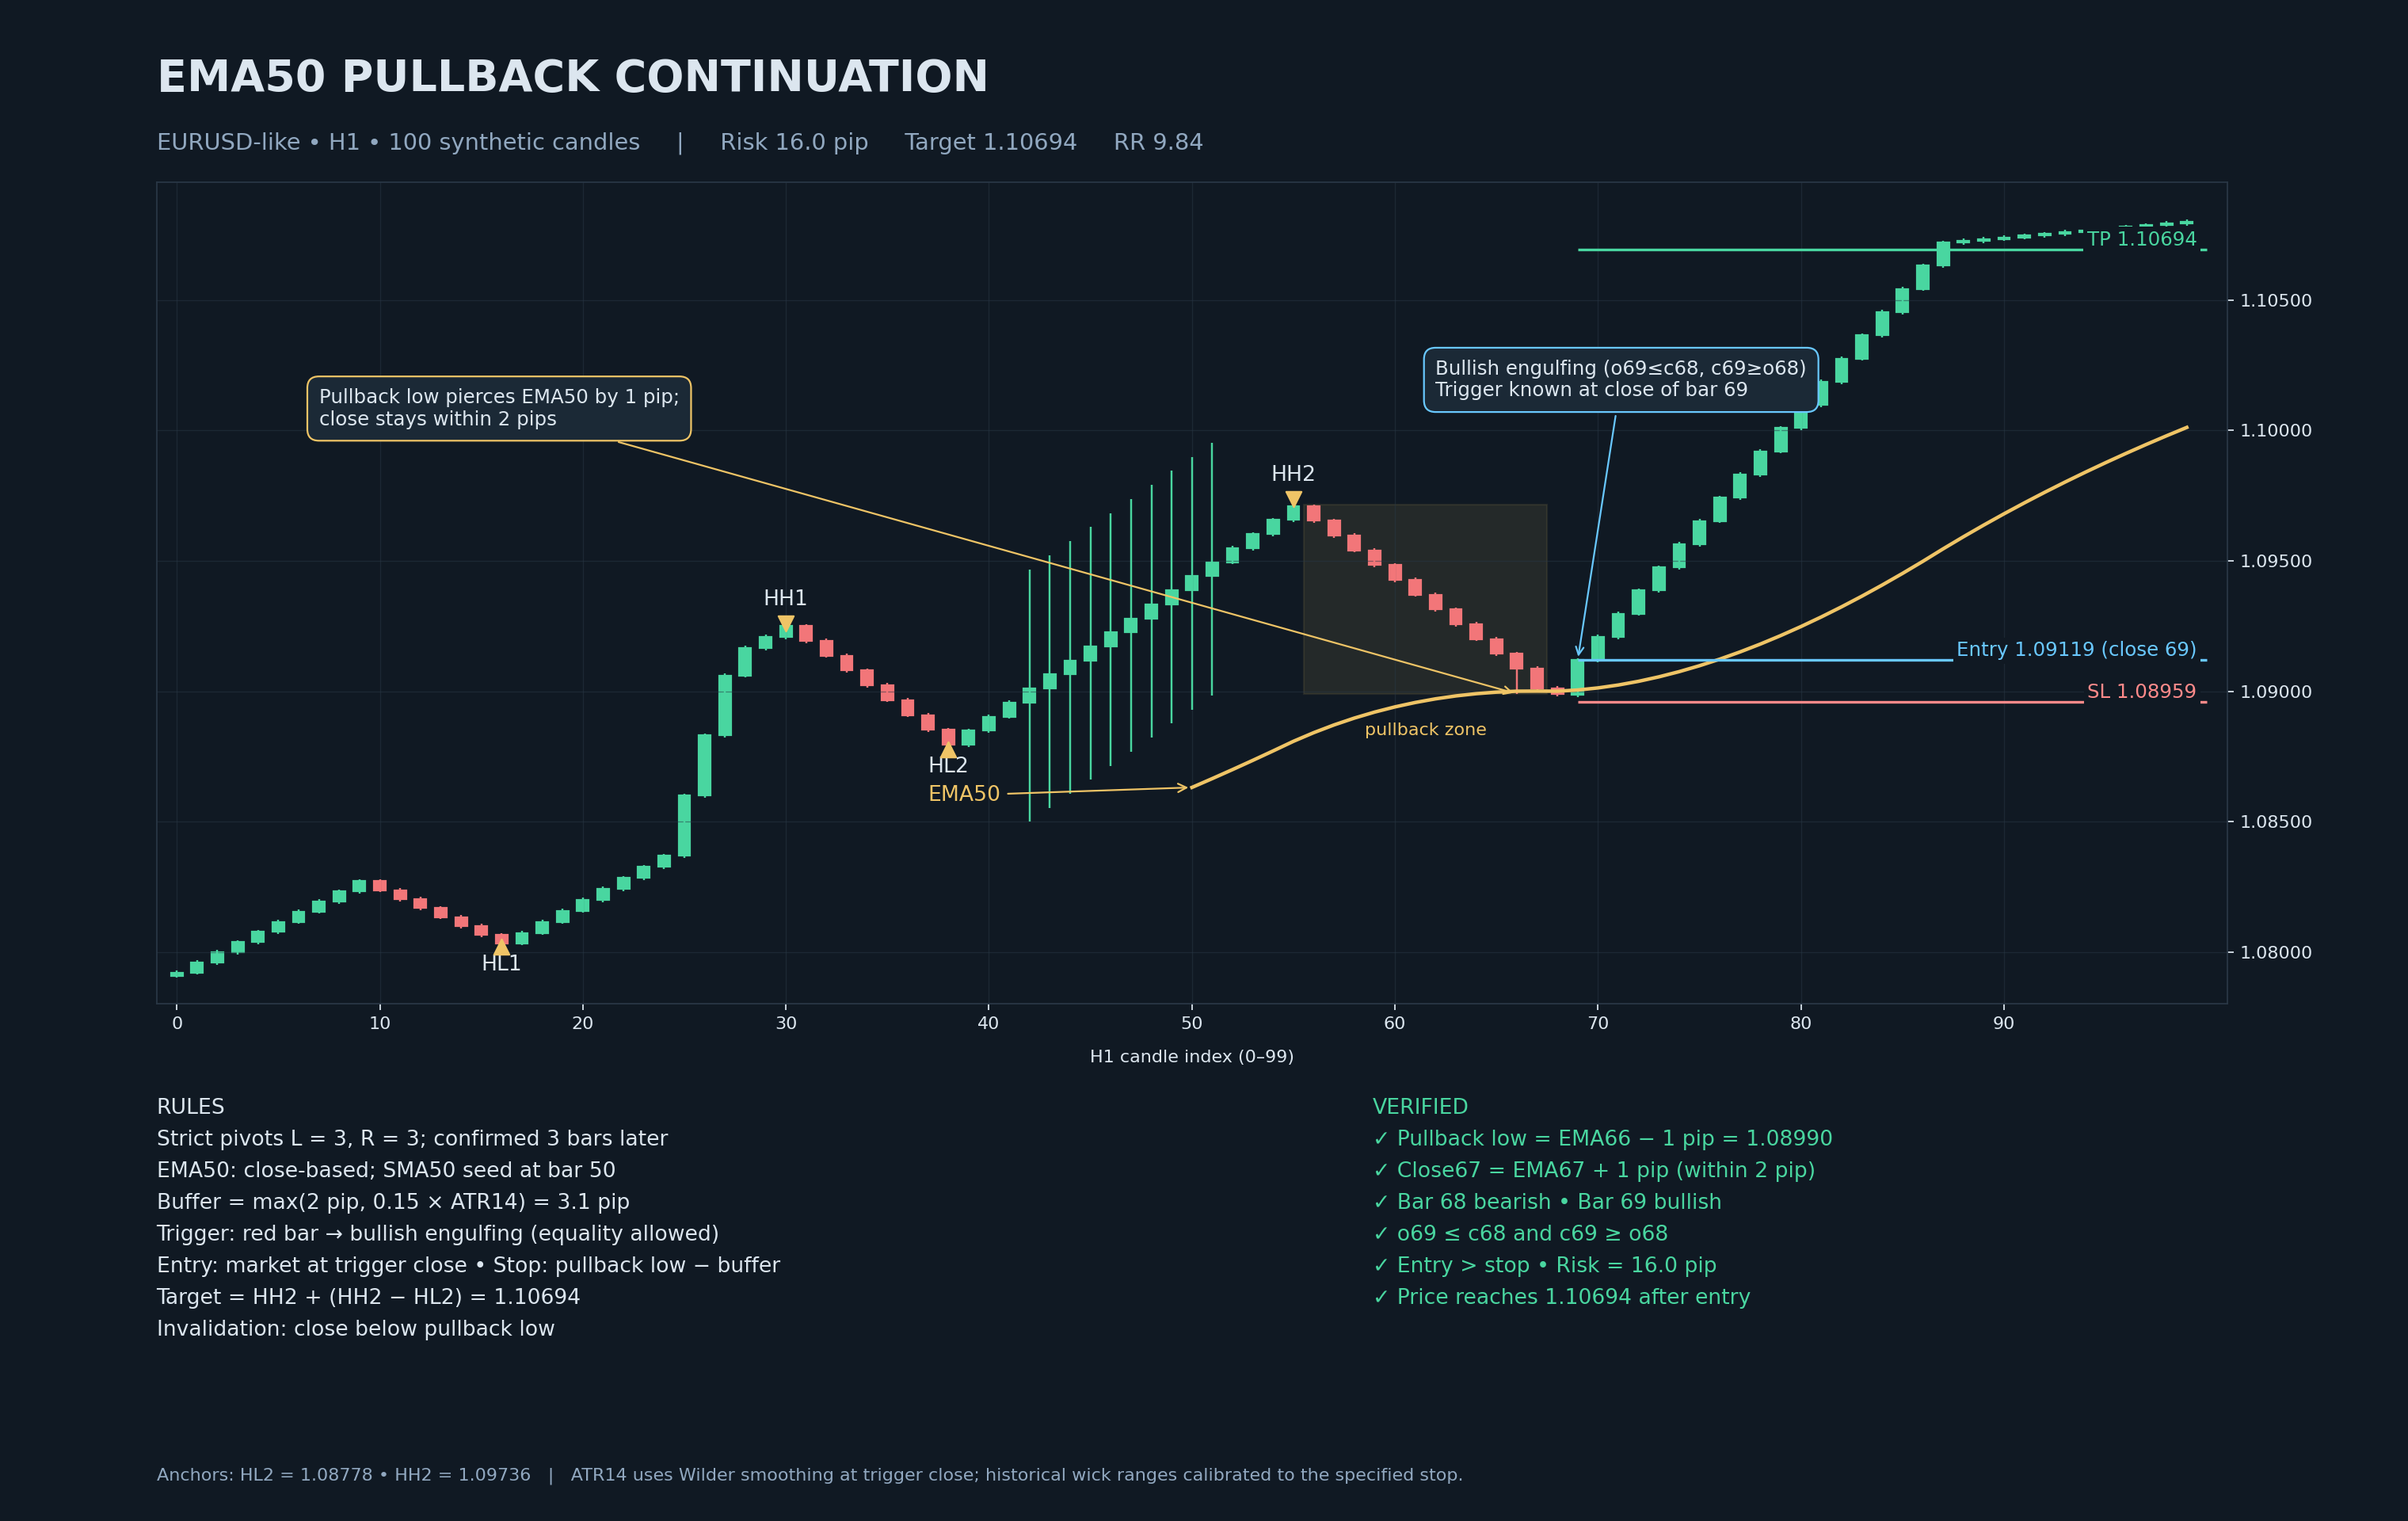
Rules
- Context: uptrend per Section 4; EMA50 rising (close-based EMA50, seeded with SMA50 at bar 50).
- Setup: pullback bar's low pierces the EMA50; the same or next bar closes back within a small tolerance of the EMA (we use 2 pips).
- Trigger: a red bar followed by a green bar whose open is at or below the red close and whose close is at or above the red open (bullish engulfing, equality permitted).
- Entry: market at the trigger bar's close.
- Stop: pullback low minus max(2 pips, 0.15 × ATR14).
- Target: the prior confirmed swing high, or a measured move = swing high + (swing high − prior swing low).
- Invalidation: a close below the pullback low, or a close back below the EMA50 after entry.
The verified example in the chart above: the pullback low pierces the EMA50 by exactly 1 pip, the next close sits 1 pip above the EMA, the engulfing trigger fires, and the stop sits 6 pips (ATR-based buffer) below the pullback low. Nothing in that description is approximate — each value is computable from the OHLC data. Full guide: EMA Pullback Strategy and Moving Average Pullback (20/50/200).
5.2 Broken level flip (support/resistance)
Rules
- Level: a resistance R touched by at least two prior rejection wicks (each within 1.5 pips of R). One touch is a candidate level; two touches make it a level worth trading.
- Breakout: the first CLOSE above R.
- Retest: after the breakout, price returns and a bar's low comes within 0.3 × ATR14 above R (the flip zone), without closing below R.
- Trigger: the next bar closes above R and above the retest bar's close.
- Entry: market at the trigger close.
- Stop: retest low minus the standard buffer.
- Target: measured move = R + (R − the swing low that preceded the breakout).
- Invalidation: any close back below R after the retest.
Full guide: Support/Resistance Flip Pullback.
5.3 Fibonacci pullback (measured retracement)
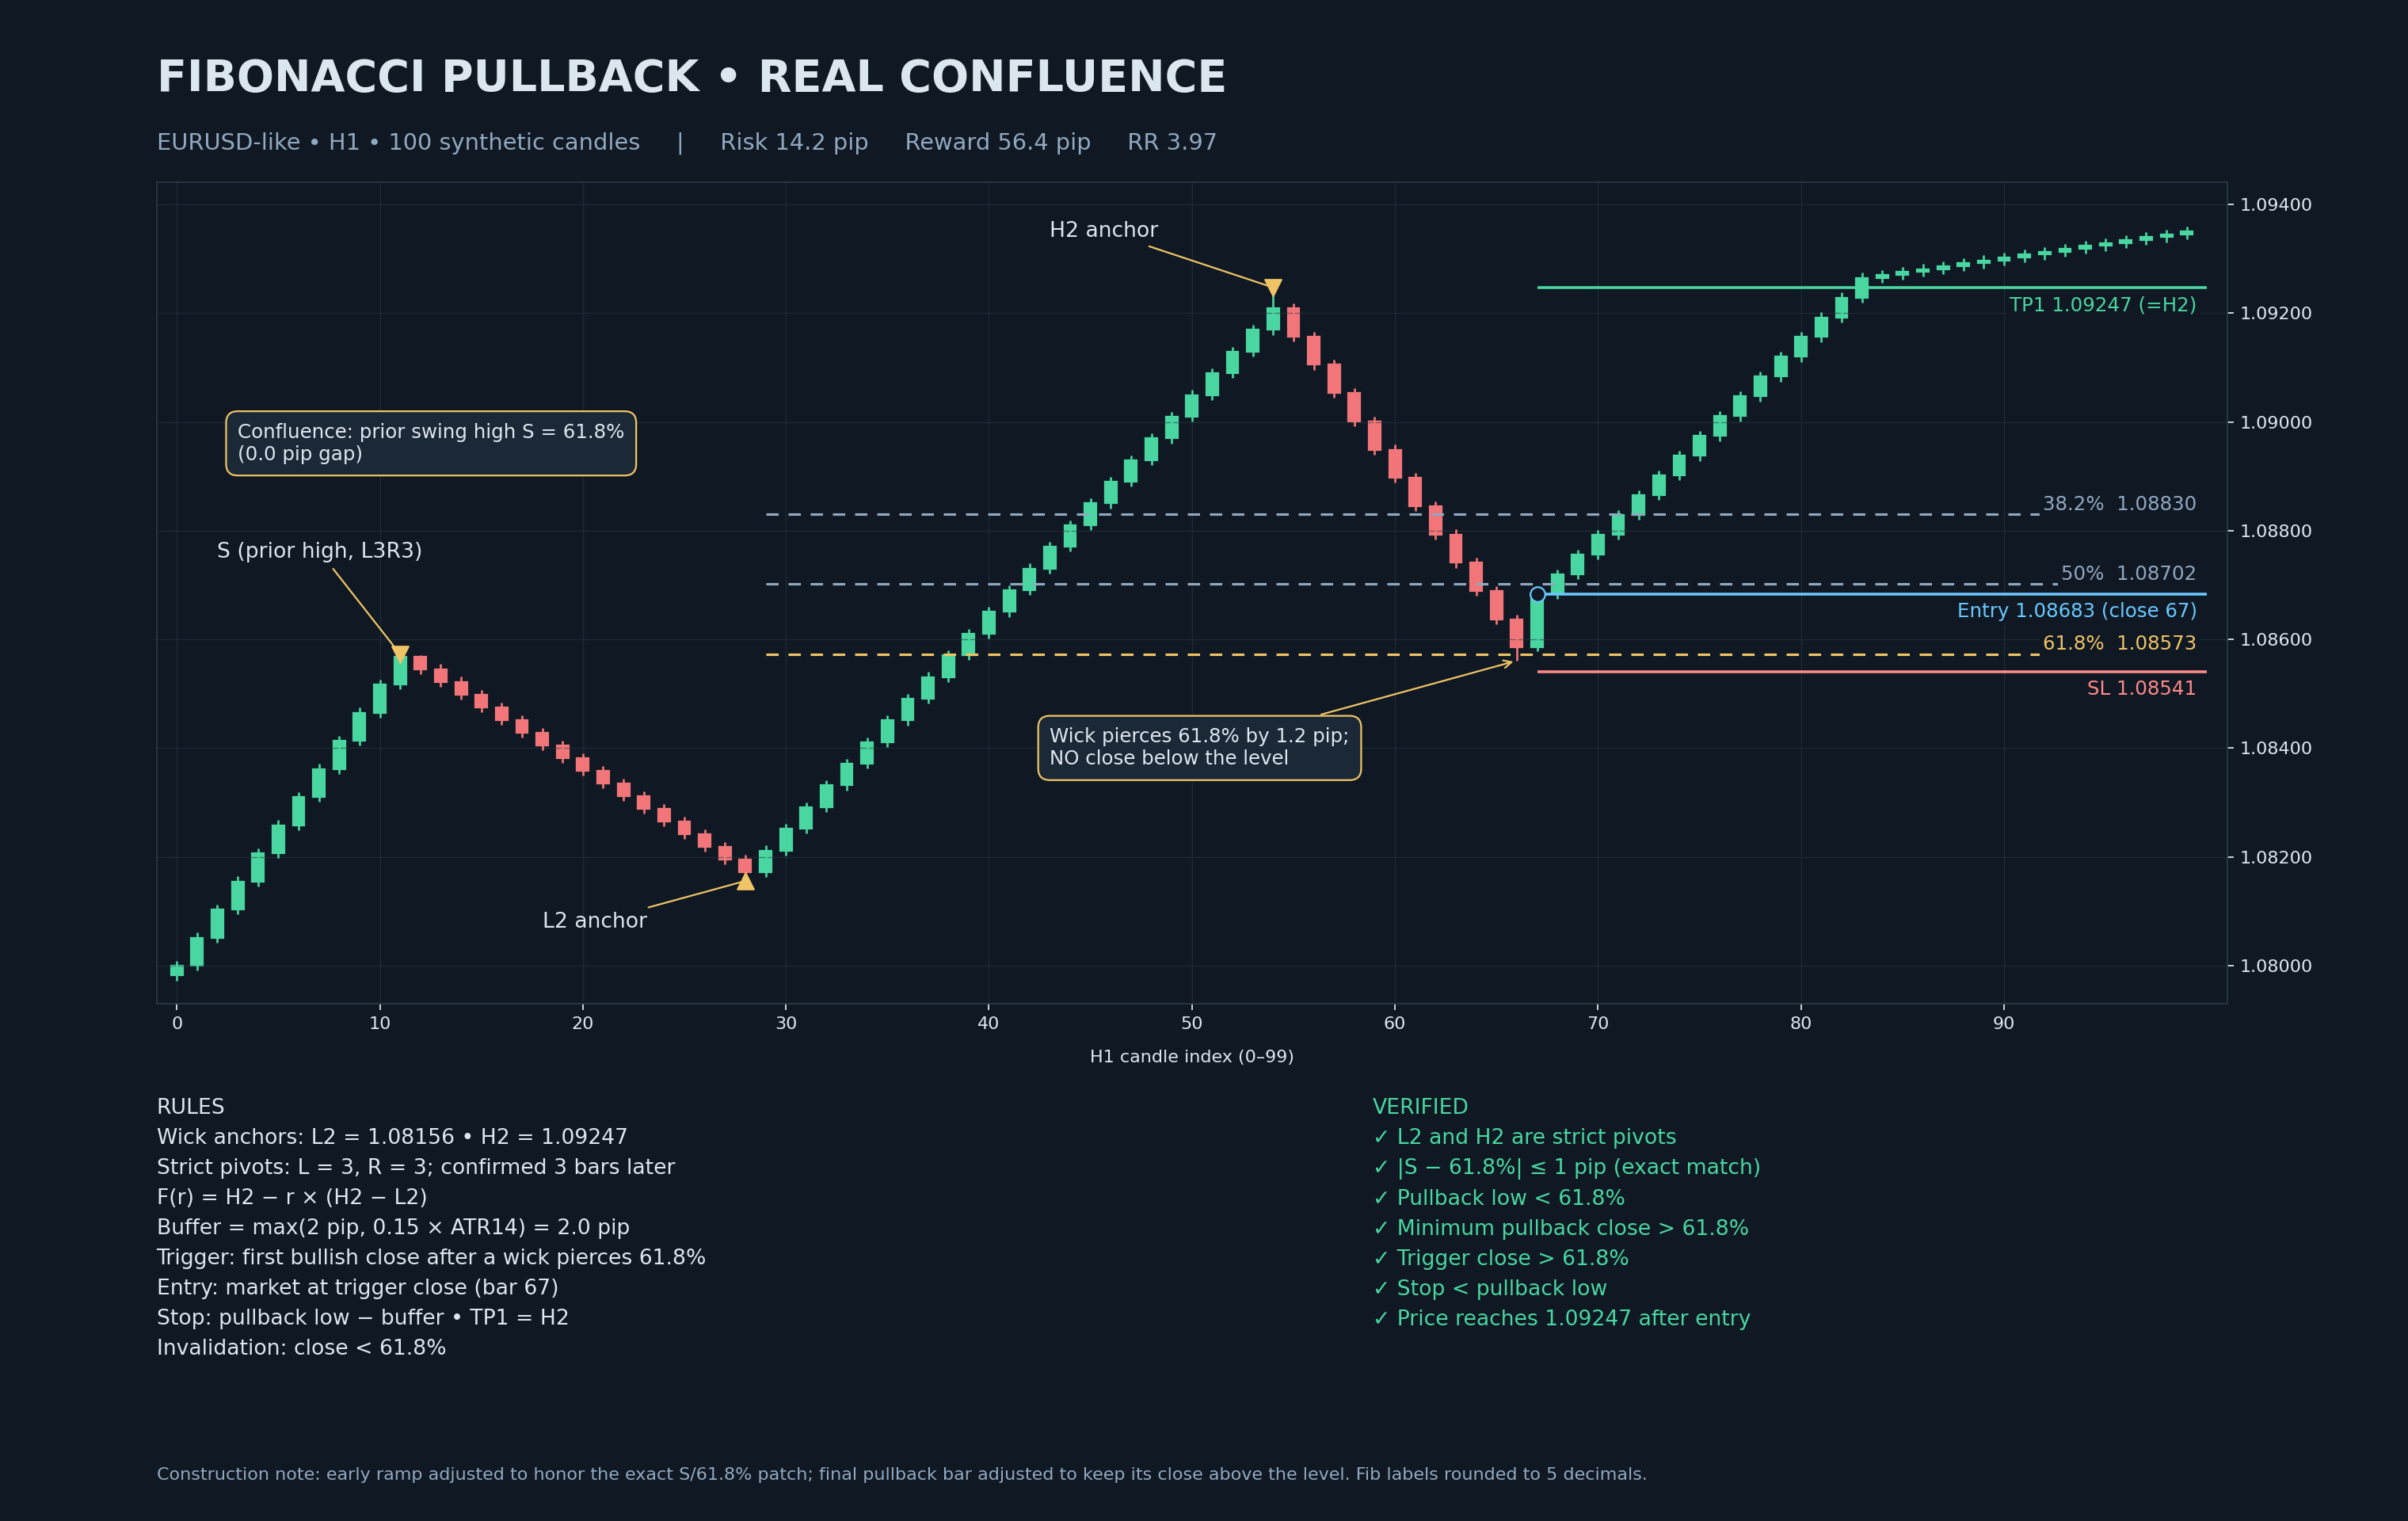
Rules
- Anchors: wick-based — the confirmed pivot low and pivot high of the impulse leg. State whether you anchor on wicks or bodies; never mix.
- Levels: \(F(r)=H-r(H-L)\) for \(r=0.382,\;0.5,\;0.618\). The 0.5–0.618 band is the reference zone, not a guarantee.
- Setup: the pullback's wick may pierce the level (tolerance up to 0.2 × ATR14); NO close beyond the level.
- Trigger: the first bullish close after a bar that pierced the level.
- Entry: market at the trigger close.
- Stop: the piercing low minus the buffer.
- Target: TP1 = the impulse high H. TP2/TP3 at 1.272/1.618 extensions of the same anchors if you scale out.
- Invalidation: a close beyond the Fibonacci level in the pullback direction.
If you claim "confluence" — say a prior swing high sitting at the 61.8% level — that claim must be verifiable: the prior pivot must exist under the stated pivot definition and sit within a stated tolerance of the level. Otherwise drop the word confluence; it is decoration, not evidence. Full guide: Fibonacci Pullback Strategy.
5.4 Demand zone / order block pullback
Rules
- Zone construction: B = the last bearish candle before a displacement move; displacement = 3 consecutive bullish closes with the third beyond B's high + 0.5 × ATR14. Zone = B's full wick range [B.low, B.high]. The zone is frozen before the retest.
- Setup: price returns; a wick enters the zone; NO close below B.low at any point (close below = zone invalid, stand aside).
- Trigger: first close above B.high after the pullback.
- Entry: market at the reclaim close.
- Stop: B.low minus the buffer.
- Target: the prior confirmed swing high H.
- Invalidation: any close below B.low.
Honest note: OHLC candles cannot prove who traded or that "institutional orders" remain at a zone. The zone is a location where price previously turned quickly — that is the observable fact. Trade the fact, not the story. Full guide: Order Block Pullback Entry.
5.5 Flag pullback (continuation channel)
Rules
- Pole: impulse from confirmed pivot low P0 to confirmed pivot high P1; height = P1 − P0.
- Channel: upper line through two confirmed flag pivot highs; lower line with the SAME slope (parallel) through the flag lows. A "channel" whose lines are not parallel is a wedge — a different pattern with different behaviour.
- Validity: at least two touches of each boundary; pullback stays inside the channel.
- Trigger: first close above the upper line.
- Entry: market at the breakout close.
- Stop: the lowest flag low minus the buffer.
- Target: entry + pole height (state explicitly that the projection origin is the breakout close, not the boundary).
- Invalidation: a close back inside the channel after breakout.
Full guide: Bull Flag & Pennant Pullback and Measured Move Targets.
6. Worked Example — Fibonacci Pullback, Full Arithmetic
Using the conventions from Section 4 and the verified chart above (synthetic EURUSD-like H1 data used for illustration). The 61.8% level is computed exactly as:
$$F(0.618)=1.09247-0.618\times(1.09247-1.08156)=1.08573$$
| Step | Value | Derivation |
|---|---|---|
| Impulse anchors | L2 = 1.08156, H2 = 1.09247 | Confirmed pivots (L=3, R=3), wick-based |
| 61.8% level | 1.08573 | 1.09247 − 0.618 × (1.09247 − 1.08156) |
| Pullback low | 1.08561 | Wick pierced the level by 1.2 pips; no close below |
| Trigger close (entry) | 1.08683 | First bullish close after the piercing bar |
| Stop | 1.08541 | Pullback low − 2.0 pips buffer (ATR-based rule) |
| Risk | 14.2 pips | 1.08683 − 1.08541 = 0.00142 |
| TP1 (H2) | 1.09247 | Reward = 1.09247 − 1.08683 = 0.00564 = 56.4 pips |
| Reward-to-risk | 3.97 | 56.4 ÷ 14.2 |
Position sizing (the arithmetic that keeps you alive)
Account: $10,000. Risk per trade: 1% = $100. EURUSD pip value for 1.00 standard lot = $10. Risk per lot = 14.2 pips × $10 = $142. Position size = $100 ÷ $142 = 0.70 lots (rounded down). Check: 0.70 lots × 14.2 pips × $10 = $99.40 ≈ $100. Use our lot size calculator and pip value calculator to automate this per instrument — pip values differ for JPY pairs, gold and indices.
7. Stop Placement and Targets — The Complete Rules
Where the stop goes
The stop's job is to be beyond the level that would prove your premise wrong — not at a round number, not at a fixed pip distance. For every model in Section 5 the premise is the same: the pullback holds its zone. Therefore the stop sits beyond the zone, plus a buffer that scales with volatility: max(2 pips, 0.15 × ATR14). If the buffer feels too wide for your risk budget, the correct response is to reduce position size or skip the trade — never to move the stop inside the zone.
Where targets go
Structure-derived targets only. In order of preference:
- The next opposing confirmed pivot (prior swing high for longs). This is the most defensible target because it is a real price where the market previously turned.
- Measured moves with stated anchors: range projection (flagpole height, breakout range) or Fibonacci extensions (1.272, 1.618) of the impulse leg.
- Scaling out: TP1 at the first structure level, TP2 at a measured extension, runner with a trailing stop. Partial exits reduce variance but also reduce average reward — there is no free lunch, only a preference.
See Stop Loss Placement for Pullback Trades and Take Profit & Partial Exits.
8. Testing Honestly — The Part Everyone Skips
An attractive completed chart proves nothing. The same setup that resolved beautifully here failed somewhere else, and the only way to know the frequency is to test. The minimum standard for an honest pullback backtest:
- Rules as Boolean conditions on completed candles, with the pivot confirmation window fixed and disclosed (ours: L=3/R=3, confirmed 3 bars later).
- No look-ahead: a pivot or trigger is used only from the bar where it becomes known.
- Costs included: spread at the actual session times you trade, commission, swap. Test both with and without to see the cost drag.
- Entry realism: market at trigger close or limit with stated expiry; no "entered at the perfect low".
- Sample size: 100+ trades per instrument/regime before believing anything; 30 trades is a story, not a statistic.
- Out-of-sample: tune on one period, then evaluate on unseen data. Report both.
- Report the ugly numbers: maximum drawdown, longest losing streak, average trade, and the distribution — not just the win rate.
For a real-data starting point, our free historical data library provides clean CSVs for backtesting, and the Python backtesting guide shows how to load them without the classic biases. The Backtest Reality Checker audits your results for the most common fakes.
9. The Five Mistakes That Destroy Pullback Traders
1. Entering before the trigger. "It's at support, I'll just buy here" — the touch is not the signal; the trigger is. Without the trigger you have no evidence the pause is ending, and no defined moment at which your entry was justified.
2. Moving the stop. The buffer exists because wicks penetrate zones. Moving the stop inside the zone converts a normal wiggle into a loss and removes the only thing protecting you from a reversal you did not foresee.
3. Fighting the higher timeframe. H1 pullback longs against an H4/D1 downtrend have a materially lower base rate. Check the higher timeframe first; it takes ten seconds.
4. Averaging into a failed pullback. When the invalidation rule fires (close beyond the zone), the premise is dead. Adding to the position is how a 1% risk becomes a 5% loss. The invalidation is not advice; it is the strategy.
5. Chasing the resumption. If price leaves the zone without you, the trade is gone. The next pullback will come — they always do. The traders who survive are the ones who can watch a move leave without them. See Pullback Trading Psychology.
10. Pullbacks and the AlgoSpecial Toolset
If you want these rules running live rather than by hand:
- The Live Forex Signals dashboard shows the D1 weekday forecast engine for 28 pairs + gold with timestamps.
- The Institutional Flow dashboard scans supply/demand zones, structure and liquidity for 50+ symbols and labels Buy Limit / Sell Limit / Buy Stop / Sell Stop plans with entry, TP1/TP2/TP3 and stop — the same concepts as Sections 5.2–5.5, automated.
- For MT5 automation of a pullback strategy of your own, see Automating Pullback Strategies in MT5 and our MT5 EA development service.
Pullback Trading — FAQ
What is a pullback in trading?
A temporary counter-trend move inside an established trend. Price moves against the trend for a limited number of bars and then the trend resumes. Trading pullbacks means entering in the trend direction when the counter-move reaches a predefined area and produces a defined trigger.
How do I know a pullback will not become a reversal?
You cannot know in advance — the difference is only visible afterwards. The professional approach is a pre-defined invalidation rule (a close beyond the structural level) and disciplined risk. Some pullback trades will fail and become reversals; the stop is what makes that survivable.
What percentage does price typically pull back?
The commonly watched zone is 38.2%–61.8% of the prior impulse with wick-based Fibonacci anchors. It is a convention, not a law; depth varies by instrument, timeframe and volatility.
Do pullback strategies work on all timeframes?
The pattern is fractal, but lower timeframes carry proportionally higher costs. A 1-pip spread against a 10-pip stop (M5 scalping) consumes 20% of your risk budget per round trip. H1 and above is where the concept is most robust for most traders.
How do I backtest a pullback strategy honestly?
Boolean rules on completed candles, disclosed pivot windows, no look-ahead, costs included, 100+ trades, out-of-sample evaluation, and full reporting of drawdown and streaks. Our Python guide and free data get you started.
Continue the Series
This guide is the hub of a 40-part pullback series. Popular next reads:
- What Is a Pullback in Trading?
- Pullback vs Retracement vs Reversal
- EMA Pullback Strategy
- Fibonacci Pullback Strategy
- Order Block Pullback Entry
- Failed Pullbacks: When Continuation Dies
- Stop Loss Placement for Pullbacks
Trade Pullbacks With Live Tools
See the concepts in this guide running live on 50+ symbols — order plans, zones, liquidity levels and AI reasoning with timestamps.
Go from article to implementation
Read the proof, then test the idea with calculators, free tools, case studies and a fixed-price build path.
Go deeper before you build, download or automate
Hand-picked engineering articles, indicator breakdowns and trading-system tools so visitors keep exploring instead of leaving after one page.

Pine Script to MT4/MT5 Conversion Planner
Analyze Pine strategies, repainting risk, TradingView alert bridges, MTF synchronization and the correct MQL4/MQL5 build path before paying for conversion.
Open planner
3-in-1 MT5 Indicator Bundle
12H Bias Engine, Smart Money Institutional Flow Dashboard and D1/H1 pending-signal logic with MQ5 + EX5 source included via Etsy.

MT5 Bank Orders Institutional Flow Dashboard
Supply/demand zones, BOS/CHoCH, liquidity levels, FVG, equal highs/lows and confirmed trade-plan logic explained with EX5 download.

MT5 Asia London NY Liquidity Engine
Asia range, London raid and New York continuation/reversal planning with internal session backtest stats and entry/SL/TP dashboard.

Interactive Brokers RSI Pair Trader
Tkinter desktop trading workflow, TWS API connection handling, RSI pair logic, risk controls and custom IBKR development positioning.

XAUUSD M30 CSV Data For Backtesting
Use clean MT5 historical data for Python backtests, strategy validation, spread checks and realistic gold EA research workflows.