What Is a Pullback in Trading?
The complete definition, the four types, how to spot one in real time — and the difference between a pullback, a correction and a consolidation that most traders never learn.
A pullback is a temporary move against the prevailing trend that ends with the trend resuming. That is the whole idea, and almost every costly mistake in trend trading comes from misunderstanding one word in it: temporary. You cannot know a counter-move is temporary while it is happening. You can only define, in advance, what would prove it permanent — and then act on that definition. Everything else in this article is detail on that foundation.
The Definition, Disassembled
Take the sentence apart and each word becomes an operational requirement:
- "Temporary" — the counter-move resolves and the trend continues. Since this is only known afterwards, the tradeable version of this word is invalidation: a specific price behaviour (usually a close beyond a defined swing) that would mean the pullback has failed.
- "Against the prevailing trend" — there must be a trend, measured with defined swing points. "It's been going up" is not a measurement. A workable definition: two or more confirmed higher highs and higher lows for an uptrend. In our series we use a strict fractal pivot — a bar whose high exceeds the 3 bars on each side — confirmed 3 bars later.
- "Move" — a counter-move is price travel: one or more bars of net movement in the opposite direction. A single long wick down is not a pullback; it is a test. The distinction matters because wick-tests and bar-pullbacks are traded differently.
- "Resumes" — the trend continues from the area where the pullback ended. This "area" is what traders mark as entries: moving averages, broken levels, Fibonacci zones, order blocks.
Pullback vs Correction vs Consolidation
These three terms describe different shapes of the same phenomenon — price moving against, or sideways to, the trend — and they are not interchangeable. Here is the working distinction:
| Term | Shape | Typical scale | Structural test |
|---|---|---|---|
| Pullback | Single counter-move (often one swing, 2–8 bars on the trading timeframe) | 23.6%–61.8% of the last impulse | Trend's defining swing is not closed beyond |
| Consolidation | Sideways range — two boundaries, repeated touches | Time-based; can last many bars | Neither boundary closes with conviction until resolution |
| Correction | Multi-leg counter-move (ABC-type, often 3+ swings) | Stock-market convention: 10%+ from the high; forex: larger multi-day counter-trend phases | Can break the first structural level and still be a correction inside a larger trend |
The practical value of this table: pullbacks are traded with continuation logic (enter in trend direction, stop beyond the pullback structure). Consolidations are traded at their boundaries (range logic — fade the edges or wait for the breakout). Corrections are environments, not setups — during a correction you reduce activity and wait for a new structural sequence to form, because the higher timeframe's trend is being repriced.
Mislabeling is expensive. Fading a consolidation edge as if it were a deep pullback, or treating a correction's first bounce as a pullback entry, are the same error: applying pullback rules to a market that is not in a pullback phase. The structural test in the table is the antidote — when in doubt, apply the test before applying the rules.
The Four Types of Pullbacks
Not all pullbacks look alike, and the type tells you how the entry will behave. Learn to name what you are looking at.
Type 1 — The single-bar pullback
One bar against the trend (or a single wick test), immediately followed by continuation. Common in strong, news-driven or momentum trends. The entry is aggressive: either at the close of the reversal-trigger bar or on a stop order above the pullback bar's high. The stop is tight (below the single bar), which makes the reward-to-risk attractive — but the fill rate is low and the stop is easy to hit because the structure is thin. Trade these only in the strongest trends, and expect many no-fills.
Type 2 — The multi-bar zigzag
Three to eight bars of counter-move, often overlapping, with one or two small internal swings. This is the classic pullback of Section 5 in our pillar guide. It offers the cleanest geometry: a defined pullback low, a defined zone, and a stop that sits beyond real structure. Most pullback strategies in the wild are really strategies for this type.
Type 3 — The gap pullback
A counter-move delivered partly through a price gap (weekend gaps in forex, opening gaps in stocks and indices). The pullback "area" includes the gap zone, and unfilled gaps often act as the magnet. Handling: treat the gap's far edge as part of the zone; widen the buffer, because gaps signal that volatility is elevated — our convention of max(2 pips, 0.15 × ATR14) automatically scales here because ATR expands around gaps.
Type 4 — The deep pullback
A retracement of 61.8%–78.6% (or even a return to the origin of the impulse) that still holds the defining swing. Deep pullbacks shake out the most traders because they feel like reversals. They are often the highest-quality entries — the stop sits just beyond a level that has now been tested twice — but only for traders whose invalidation rule is close-based and who can tolerate the emotional pressure. We cover these separately in Deep Pullback vs Shallow Pullback.
Pullbacks in Different Markets — Same Idea, Different Physics
The pullback concept is universal, but each market class bends it in ways that change how you trade it:
Forex
Currency pairs trade 24 hours, five days a week, which produces two important behaviours. First, pullbacks are continuous rather than gappy during the week — the counter-move often unfolds in smooth overlapping bars. Second, pullbacks that begin in one session frequently pause and resolve in the next: a London-session pullback into an H1 zone may sit untouched for hours during the Asian lull and only trigger when European volume returns. Practical consequence: prefer entries during the sessions that carry the instrument's volume (London and New York for EURUSD, GBPUSD; Tokyo for JPY crosses and AUDJPY), and be sceptical of triggers that fire on thin liquidity, because spreads widen exactly when your stop is closest. Our session clock shows the windows.
Indices and stock CFDs
Cash indices (US500, US30, NAS100, GER40) have official session hours and opening auctions. Pullbacks that arrive near the cash open inherit gap risk: the "zone" you marked the previous evening may be jumped entirely by an opening gap, turning your limit order into a market order at a materially different price. The professional handling is to treat the pre-open zone as valid only after the first 15–30 minutes of price discovery, and to use the opening range itself as the pullback reference for the day. Weekly index pullbacks, by contrast, behave more like forex — continuous intraday movement during the 24-hour CFD session.
Crypto
Crypto trades continuously, including weekends, and its volatility is structurally higher. The same pullback percentage means a much larger absolute move, and wick penetration of zones is routinely deeper. Two adaptations: widen buffers relative to your forex habits (the ATR-scaled buffer from our framework does this automatically), and expect the 61.8–78.6% band to be reached far more often — crypto pullbacks are deep by nature. The core structure test does not change: closes define validity, wicks define tolerance.
Stocks
Single stocks add two variables that indices and forex do not have: earnings dates and liquidity vacuums. A pullback set up the day before an earnings release is not the same trade — the event can gap price through both your zone and your stop. The rule we use: no new pullback entries in the 24 hours before a scheduled earnings release or major event for that specific instrument, no matter how clean the structure. The economic calendar covers the macro side of this for forex and indices.
Across all four markets, the invariant is the same: a trend measured with defined swings, a destination, a trigger, an invalidation. The market class changes the parameters — session, buffer size, gap policy — not the architecture.
The Liquidity Behind the Pullback
There is one more mechanical layer worth understanding, because it explains why pullbacks so often end with a violent wick rather than a gentle touch. Markets contain clusters of resting orders — stop losses and breakout orders — at predictable places: below equal lows, above equal highs, under obvious round numbers. A pullback into a zone frequently overshoots the zone's far edge by a few pips for exactly one reason: the counter-move is being used to reach and consume that liquidity before the trend resumes.
This is the phenomenon traders call the liquidity sweep (or stop hunt). Its fingerprint: price pierces an obvious level, takes out the resting orders, and closes back on the trend side of the level within one or two bars. Three practical consequences for pullback traders:
- Wick tolerance is not optional. If your invalidation were wick-based, every liquidity sweep would stop you out at the exact low from which the trend resumed. This is the single strongest argument for close-based invalidation — the rule our entire series uses.
- The sweep can be your confirmation. A pullback that pierces an obvious level and closes back above it is often a higher-quality setup than one that touches politely, because the sweep has cleared the path. See Liquidity Sweeps as Pullbacks.
- Buffer placement matters more than buffer size. The standard buffer — max(2 pips, 0.15 × ATR14) — exists to place the stop beyond the sweep's likely reach, not merely beyond the zone. On instruments with heavy sweep behaviour (gold, indices), the ATR term dominates and the buffer widens automatically.
You do not need to believe anyone is hunting your specific stop for this to matter. The orders exist, they are reachable, and the mechanics of filling large positions profit from reaching them. The pullback trader's response is procedural, not conspiratorial: define the level, allow the wick, demand the close.
How to Spot a Pullback — Step by Step
A repeatable five-step procedure, in the order a live chart reveals information:
- Establish the trend. Find confirmed swing points (strict fractal, L=3/R=3, confirmed 3 bars later — never earlier). For an uptrend you need at least two higher highs and two higher lows.
- Mark the defining level. In an uptrend, that is the most recent confirmed higher low. This level is your trend's life line: as long as closes stay above it, pullback logic applies.
- Wait for the counter-move to reach a destination. A destination is a predefined area: a rising EMA, a broken level, a Fibonacci zone, an order block, a flag boundary. If price reverses before reaching any defined destination, there is no setup — a pullback needs a location.
- Check the behaviour. Shrinking ranges and overlapping candles into the zone suggest a pause. Expanding ranges against the trend suggest a possible reversal in progress — treat the setup as suspect and let the trigger be your referee.
- Demand a trigger. Enter only when the counter-move shows a defined end: an engulfing close, a reclaim close above a zone, a break of the pullback's own mini-structure. The trigger is the difference between a plan and a hope.
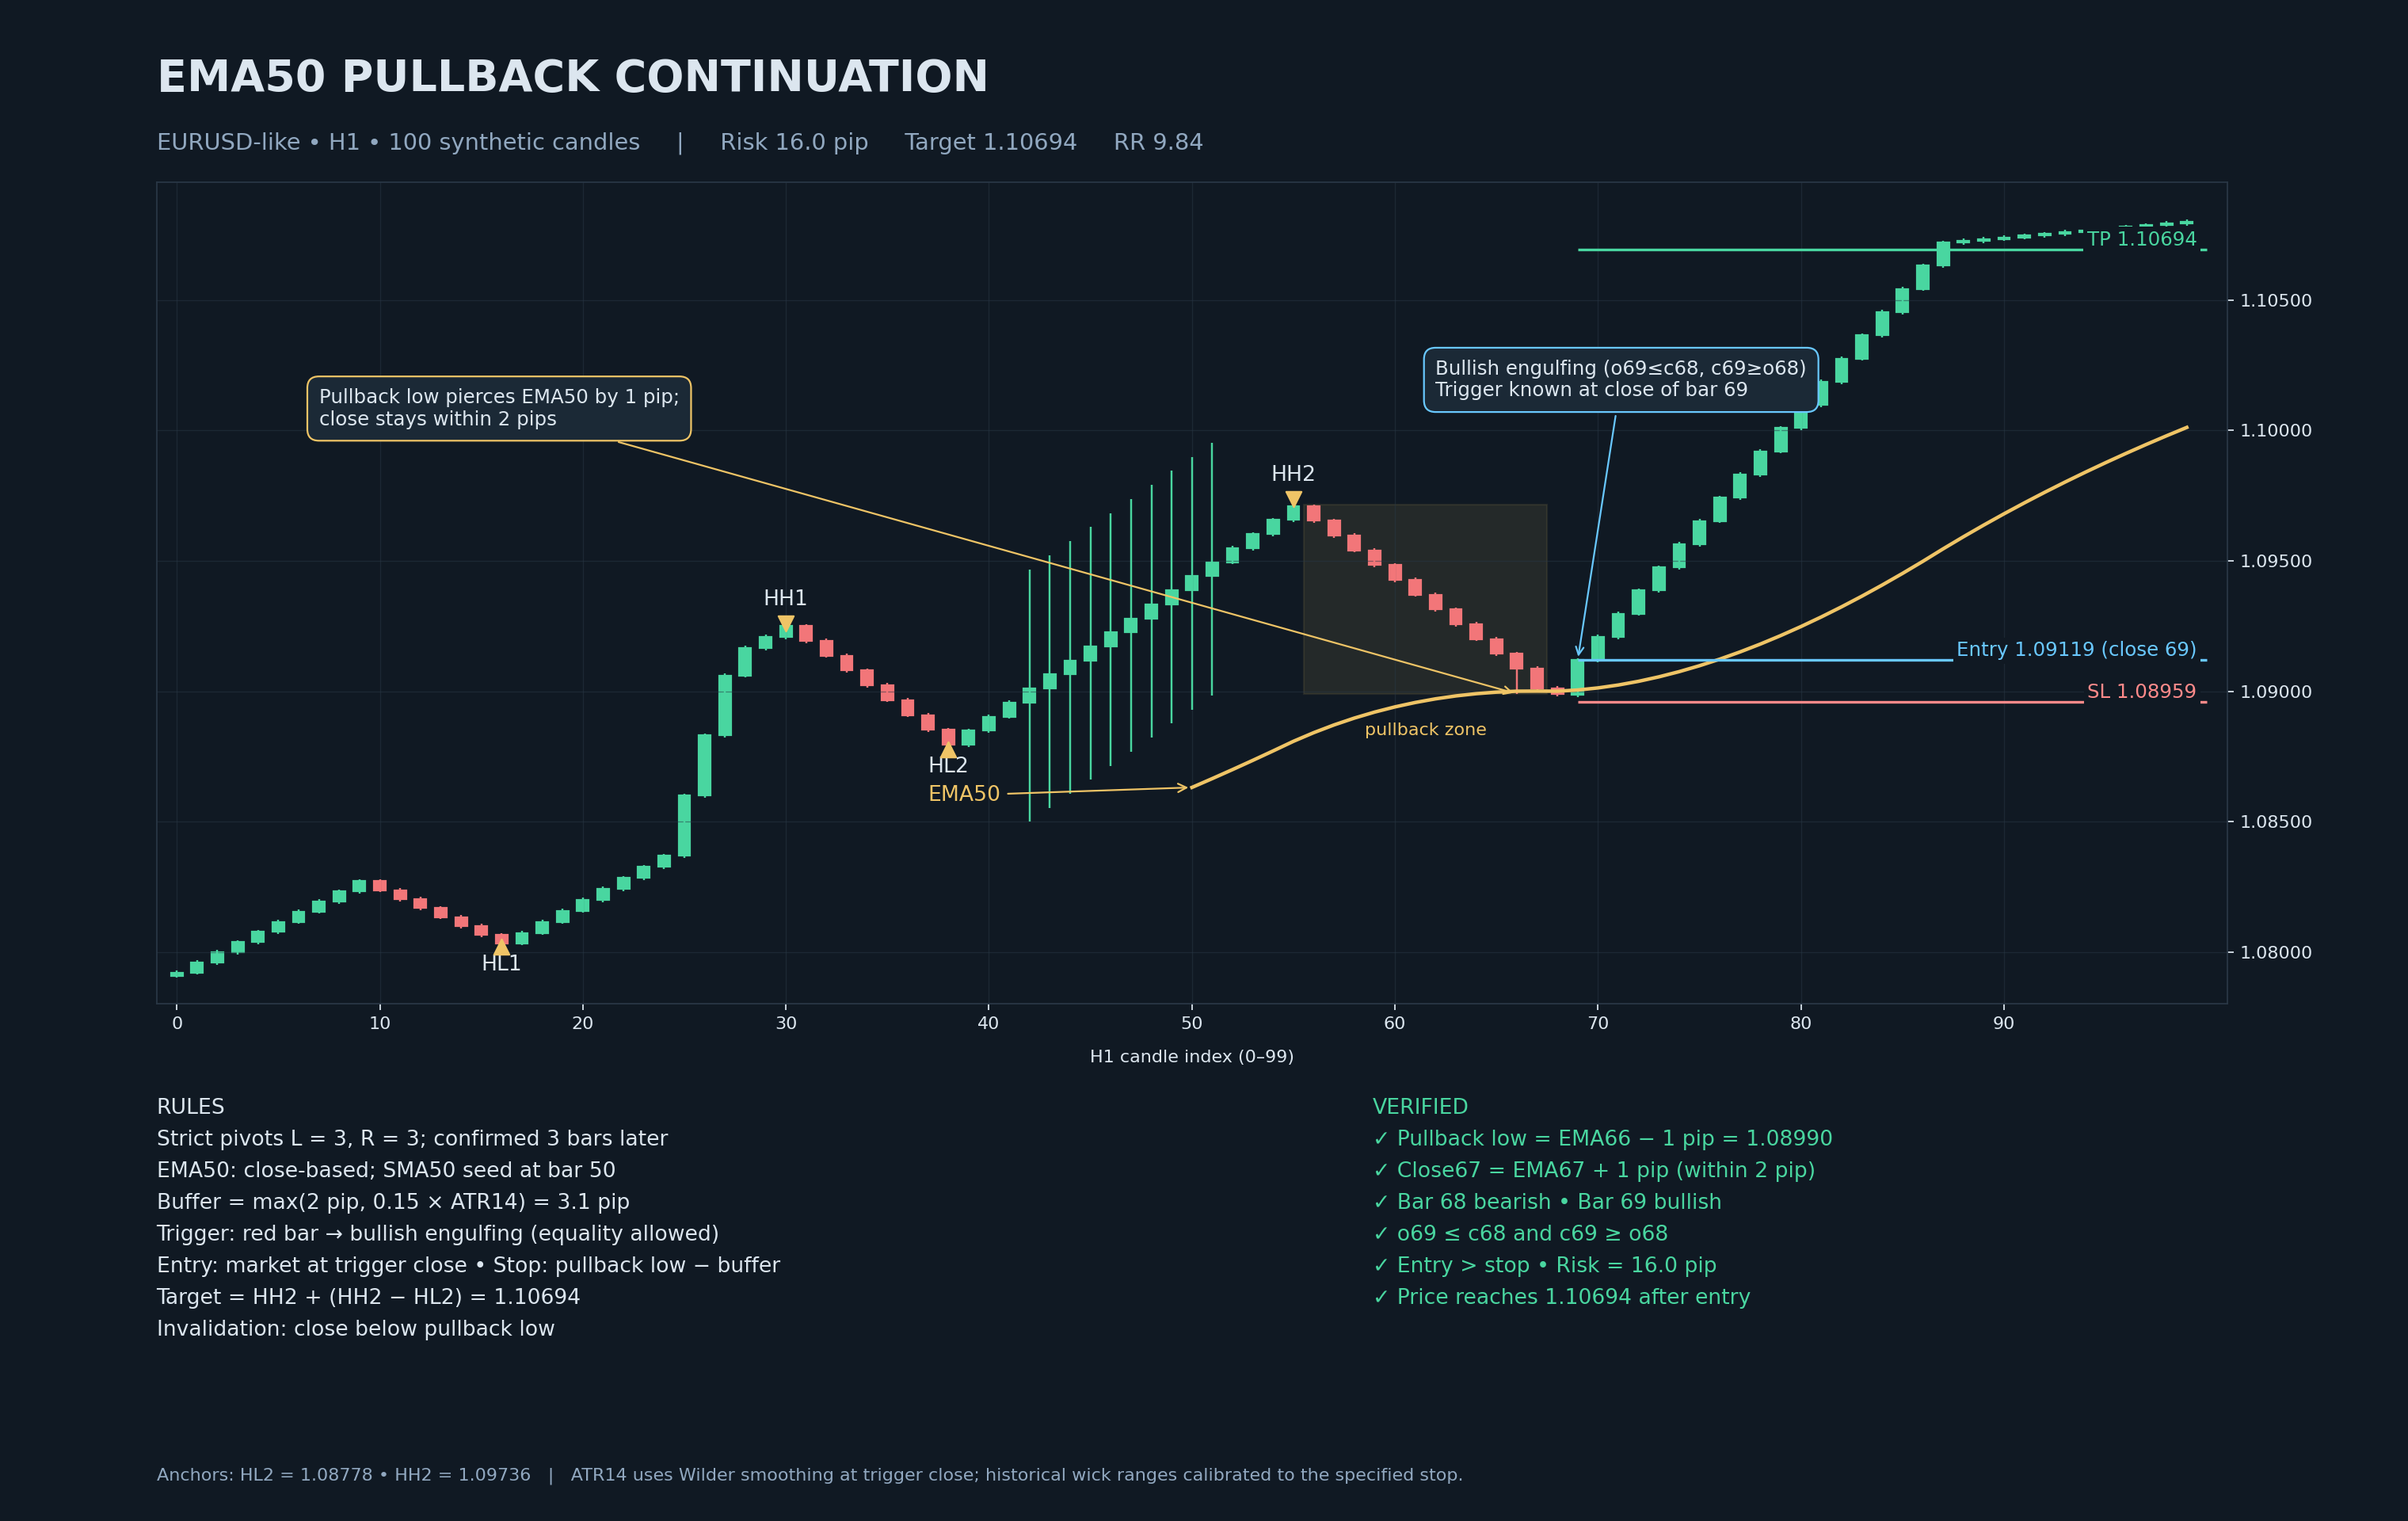
In the verified chart for our EMA model (linked below), the sequence is exactly this procedure: uptrend with confirmed HH/HL, defining level marked, pullback travels to the EMA50 and pierces it by one pip, behaviour contracts, and the engulfing trigger fires. Every element was knowable in real time — that is the standard this series holds itself to.
What Pullbacks Are Not
Four mislabels that generate losing trades:
A pullback is not a range. If price is oscillating between two levels with no directional sequence of swings, there is no trend to pull back from. Pullback rules in a range buy the top of the range and sell the bottom.
A pullback is not the first counter-move after a parabolic move. Parabolic advances often end with violent mean reversion; the first "pullback" after a vertical move is statistically a different animal from a pullback inside an established, orderly trend. If the trend itself was unsustainable, its pullback inherits that fragility.
A pullback is not a wick into a level without follow-through. A test that closes back immediately is a liquidity event; the tradeable version requires the trend to actually resume with a trigger.
A pullback is not "cheaper, therefore safer". A lower entry price with the same invalidation logic improves reward-to-risk — it does not improve the probability that the trend continues. Those are different numbers and confusing them is how traders oversize "obvious" pullbacks.
Why Traders Prefer Pullback Entries — The Honest Math
Take a concrete scenario on EURUSD. Support at 1.0800. Price rallies 50 pips to 1.0850. Then two futures:
- Breakout chase: buy at 1.0850 with a stop 20 pips below (1.0830) and a target of 1.0900 (50 pips). Reward-to-risk = 50 ÷ 20 = 2.5.
- Pullback entry: price retraces 25 pips to 1.0825 (the 50% level). Buy there with a stop 15 pips below (1.0810) and the same 1.0900 target (75 pips). Reward-to-risk = 75 ÷ 15 = 5.0.
The pullback entry has double the reward-to-risk on identical targets — because the stop is closer to real structure and the entry is further from it. Now the honest part: the pullback entry has a lower fill probability. Price may never retrace; you watch the move leave without you. The full comparison — fill rates, missed trades, and when chasing is actually correct — is in Pullback vs Breakout Entry. The summary: pullbacks win on geometry, breakouts win on participation, and a professional uses both with rules for each.
Pullbacks Across Timeframes — The Fractal Truth
The same pullback concept exists on every timeframe, but they nest inside each other in a way that trips up beginners. A 4-hour pullback contains several 15-minute reversals. A daily pullback contains entire 4-hour downtrends. This means the label "pullback" is always relative to a chosen timeframe:
- What looks like a violent reversal on M5 is often just the first hour of a normal pullback on H4.
- What looks like a pullback on H1 may be the early stage of a reversal on D1 — and only the D1 structure can tell you which interpretation has higher odds.
The working rule from our pillar guide: before trading a pullback on your timeframe, check the structure one and two timeframes higher with the same pivot definition. If the higher timeframe's trend agrees, the pullback has the wind behind it. If it disagrees, you are likely trading a counter-trend bounce dressed up as a pullback. See Multi-Timeframe Pullback Alignment.
Myths That Cost Money
Myth 1: "Pullbacks always reach the 50% level." No. Strong trends often turn at 23.6–38.2%. If you only arm entries at 50%, you systematically miss the strongest trends and over-participate in the weakest ones — the exact opposite of what you want.
Myth 2: "Buying the dip is pullback trading." Buying any dip without trend structure, destination and invalidation is not a strategy; it is a hope with a chart attached. Pullback trading is the disciplined subset of dip-buying that defines all three.
Myth 3: "A pullback that fails was a mistake." A failed pullback executed with a defined stop is a cost of doing business, not an error. The error is only ever: no invalidation rule, or no stop discipline. Our dedicated guide: Failed Pullbacks.
Myth 4: "Indicators make pullbacks safer." Indicators mark zones conveniently; they do not verify structure. An RSI oversold reading in a downtrend is not a pullback setup — it is a trend doing what trends do. Zones are conveniences; structure is the evidence.
Where Pullbacks End — The Five Destinations
Every pullback entry model in this series is a variation of "price reaches destination X and the counter-move ends":
- Moving averages — the average acts as a dynamic pullback zone. Rules: EMA pullback strategy.
- Broken levels — previous resistance becomes support (the flip). Rules: S/R flip pullback.
- Fibonacci zones — measured retracement of the impulse. Rules: Fibonacci pullback strategy.
- Order blocks / demand-supply zones — the origin of the displacement. Rules: Order block pullback entry.
- Flag boundaries — the parallel channel of a pause. Rules: Bull flag pullback.
Notice what is common: a predefined location, a trigger, and an invalidation. The location changes; the discipline does not. That is the entire architecture of pullback trading, and the pillar guide builds the complete system on it: Pullback Trading Strategy — The Complete Guide.
FAQ
What is a pullback in simple terms?
A short pause in a trend: price moves temporarily against the trend, then continues. It is the market finding new participants at better prices before the trend resumes.
Is a pullback the same as a correction?
No. A pullback is a short single counter-move inside a trend; a correction is a larger multi-leg counter-move (commonly 10%+ in stocks). Corrections are environments — reduce activity and wait for new structure; pullbacks are setups.
How many candles should a pullback last?
No fixed number — typically 2–8 bars on the trading timeframe, but the reliable test is structural: the pullback must not close beyond the trend's defining swing. If it does, it has stopped being a pullback.
Does a pullback have to reach the 50% level?
No. Depth varies: 23.6–38.2% in strong trends, 38.2–61.8% in normal conditions, up to 78.6% in deep pullbacks that still hold. Depth is information about trend health, not a requirement.
Can you trade pullbacks without indicators?
Yes — pure price structure (swing sequence, defining level, trigger candle) is sufficient. Indicators like moving averages and RSI are conveniences that mark zones, not sources of evidence.
Continue the Series
- Pullback Trading Strategy — The Complete Guide (pillar)
- Pullback vs Retracement vs Reversal
- Why Pullbacks Happen — Market Mechanics
- Pullback or Reversal? How to Tell
- Pullback vs Breakout Entry
See Pullback Structure Scanned Live
Our Institutional Flow dashboard scans structure, zones and liquidity across 50+ symbols and labels order plans with exact entries, stops and targets.
Go from article to implementation
Read the proof, then test the idea with calculators, free tools, case studies and a fixed-price build path.
Go deeper before you build, download or automate
Hand-picked engineering articles, indicator breakdowns and trading-system tools so visitors keep exploring instead of leaving after one page.

Pine Script to MT4/MT5 Conversion Planner
Analyze Pine strategies, repainting risk, TradingView alert bridges, MTF synchronization and the correct MQL4/MQL5 build path before paying for conversion.
Open planner
3-in-1 MT5 Indicator Bundle
12H Bias Engine, Smart Money Institutional Flow Dashboard and D1/H1 pending-signal logic with MQ5 + EX5 source included via Etsy.

MT5 Bank Orders Institutional Flow Dashboard
Supply/demand zones, BOS/CHoCH, liquidity levels, FVG, equal highs/lows and confirmed trade-plan logic explained with EX5 download.

MT5 Asia London NY Liquidity Engine
Asia range, London raid and New York continuation/reversal planning with internal session backtest stats and entry/SL/TP dashboard.

Interactive Brokers RSI Pair Trader
Tkinter desktop trading workflow, TWS API connection handling, RSI pair logic, risk controls and custom IBKR development positioning.

XAUUSD M30 CSV Data For Backtesting
Use clean MT5 historical data for Python backtests, strategy validation, spread checks and realistic gold EA research workflows.