Daily Range Backtest Levels Indicator for MT5 — Free Download
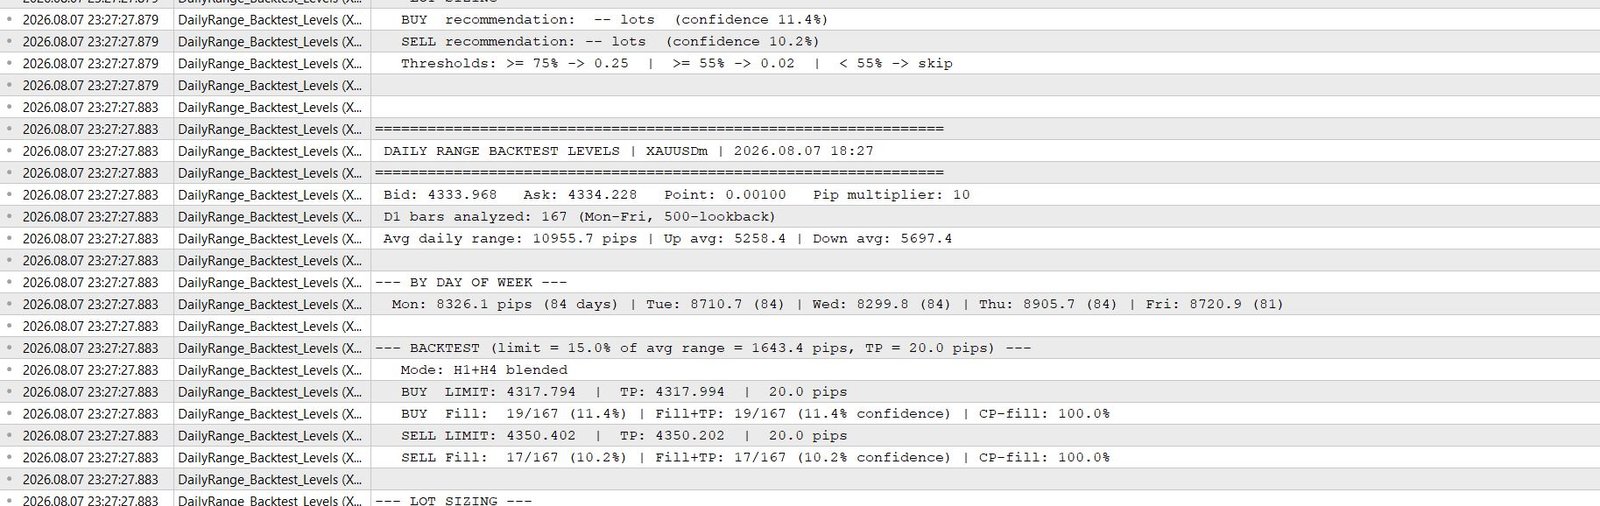
Compiled for MT5. Works on any symbol. Drag onto chart. Instant backtest results.
The Question Every Trader Needs Answered
You have a price level where you want to place a limit order. Maybe it's a support zone. Maybe it's an RSI target. Maybe it's yesterday's low. The question is always the same: "If I place my limit order here, what are the odds it actually fills and hits my take-profit?" Most traders never answer this question. They place the order and find out. This indicator answers it — with causal walk-forward validation, not curve-fitted hindsight.
How It Works — Causal Walk-Forward Validation
Step 1 — Training Phase
The indicator loads up to 500 D1 bars (configurable, Mon-Fri GMT only). It splits them using your configured WalkForwardSplitPct (default 60%). The first 60% is the training set. From this data, it calculates: average daily range in pips, average up move (open → high), average down move (open → low), and per-day-of-week averages (Mon through Fri with individual bar counts).
Step 2 — Order Level Calculation
Using the training period average range, the indicator computes today's suggested limit order prices: Buy Limit = Ask − (BuyLimitPctOfRange% × avg range) and Sell Limit = Bid + (SellLimitPctOfRange% × avg range). Default distance: 15% of average range. The take-profit distance is your configured TakeProfitPips value. These levels are recalculated at every new bar and displayed on the chart.
Step 3 — Walk-Forward Backtest
This is where the indicator earns its name. For every day in the 40% out-of-sample test period, it anchors limit orders to that specific day's open price (not today's open — each day gets its own anchor). Then it runs bar-by-bar simulation on two timeframes:
- H1 (24 bars per day): High-resolution check. Scans each hour for whether price touched the limit level and whether it later reached the TP level.
- H4 (7 bars per day): Broader check. Confirms the H1 results aren't just 1-hour noise.
Each day gets independent fill and TP flags. The final confidence is the blended H1+H4 average of days where both fill AND TP occurred. You also get per-timeframe breakdowns (H1 fill count, H1 TP count, H4 fill count, H4 TP count) so you can see if the results are consistent or if one timeframe is driving the numbers.

Output — What You Get
- Fill Probability: % of test days where the limit order was reached
- Fill+TP Confidence: % of test days where the order filled AND TP was hit — this is your confidence score
- Conditional TP%: Given the order filled, what % of the time did TP hit
- Auto Lot Sizing: ≥75% → 0.25 lots | ≥55% → 0.02 lots | below → skip (configurable thresholds)
- Per-Day-of-Week Ranges: Mon through Fri average ranges with bar counts
- H1+H4 Breakdown: Individual fill and TP counts per timeframe
Chart Visualization
Buy limit lines (green dashed), sell limit lines (red dashed), TP lines (green/red dotted). Levels only appear when confidence exceeds the minimum threshold — if confidence is too low, no lines are drawn. The dashboard displays in the top-left corner with a dark background for readability against any chart.
Pair It with RSI MTF Price Levels
This indicator tells you HOW LIKELY your limit orders are to fill and hit TP. The RSI MTF Price Levels indicator tells you WHERE to place those orders — at exact RSI-based price levels with confluence scores across M15/M30/H1/H4. Together they form a complete, backtested limit order system.
Get Both Source Codes — $130 One-Time
DailyRange_Backtest_Levels.mq5 (754 lines) + RSI_MTF_PriceLevels.mq5 (2,028 lines). Full source. Commercial use.
Buy Source Code — $130Quick FAQ
What's walk-forward validation?
Training and testing use different time periods. The indicator NEVER tests on data it trained on. If WalkForwardSplitPct=60, the backtest only runs on the last 40% of days — data the model has never seen. No curve-fitting.
Does it work on all pairs?
Yes. Attach it to any symbol. It analyzes that symbol's D1 bars. Results vary by pair — some pairs have more reliable daily ranges than others.
Why H1+H4 and not M15 or M5?
Lower timeframes generate too many false fills from noise. H1 provides enough granularity for intraday fill detection. H4 confirms the signal isn't just an hourly whipsaw. Blending both gives the most reliable probability estimate.
Choose the next useful step
Most visitors arrive with one question: build, test, price, or trust. These shortcuts keep the path practical.
Go deeper before you build, download or automate
Hand-picked engineering articles, indicator breakdowns and trading-system tools so visitors keep exploring instead of leaving after one page.

Pine Script to MT4/MT5 Conversion Planner
Analyze Pine strategies, repainting risk, TradingView alert bridges, MTF synchronization and the correct MQL4/MQL5 build path before paying for conversion.
Open planner
3-in-1 MT5 Indicator Bundle
12H Bias Engine, Smart Money Institutional Flow Dashboard and D1/H1 pending-signal logic with MQ5 + EX5 source included via Etsy.

MT5 Bank Orders Institutional Flow Dashboard
Supply/demand zones, BOS/CHoCH, liquidity levels, FVG, equal highs/lows and confirmed trade-plan logic explained with EX5 download.

MT5 Asia London NY Liquidity Engine
Asia range, London raid and New York continuation/reversal planning with internal session backtest stats and entry/SL/TP dashboard.

Interactive Brokers RSI Pair Trader
Tkinter desktop trading workflow, TWS API connection handling, RSI pair logic, risk controls and custom IBKR development positioning.

XAUUSD M30 CSV Data For Backtesting
Use clean MT5 historical data for Python backtests, strategy validation, spread checks and realistic gold EA research workflows.