Multi-Timeframe RSI Price Level Indicator for MT5 — Free Download

Compiled for MT5. Drop in MQL5/Indicators. Restart MT5. Ready.
This Is Not a Standard RSI Indicator
Standard RSI indicators show you a line. They tell you RSI is at 34.7 or 72.1. They leave you to figure out what price levels correspond to oversold or overbought conditions. This indicator does the opposite — it shows you the exact prices on your chart where RSI will hit 80, 75, 25, and 20 across four timeframes simultaneously. Think of it as an RSI-to-price translator.
How It Works — Dual Analysis Engine
Method A — Historical Price Clustering
The indicator scans 300 closed bars (configurable) on each timeframe independently — M15, M30, H1, H4. Every time RSI(22) crosses a threshold — dropping below 25, pushing above 80 — it records the closing price. These prices are clustered using ATR-normalized tolerance. The best cluster is selected via a 4-component composite score: 35% frequency (how many crossing episodes), 30% recency (how recently they occurred), 20% tightness (price dispersion), and 15% distance from current market. Output: a representative price, cluster bounds, occurrence count, and relevance score.
Method B — Wilder RSI Forward Projection (Unique Feature)
This is what separates this indicator from every other RSI tool. The indicator implements its own Wilder RSI calculation to access the smoothing state (avgGain and avgLoss) that MT5's built-in iRSI function keeps hidden. Using this state from the last closed bar, it runs a binary search solver: "What future close price makes RSI exactly equal to 80?" The solver converges monotonically because RSI is strictly monotonic in the hypothetical close. Safety limits prevent projection beyond 8 ATR units. Maximum 60 iterations. Tolerance 0.05 RSI units.
7-Component Confluence Scoring Engine
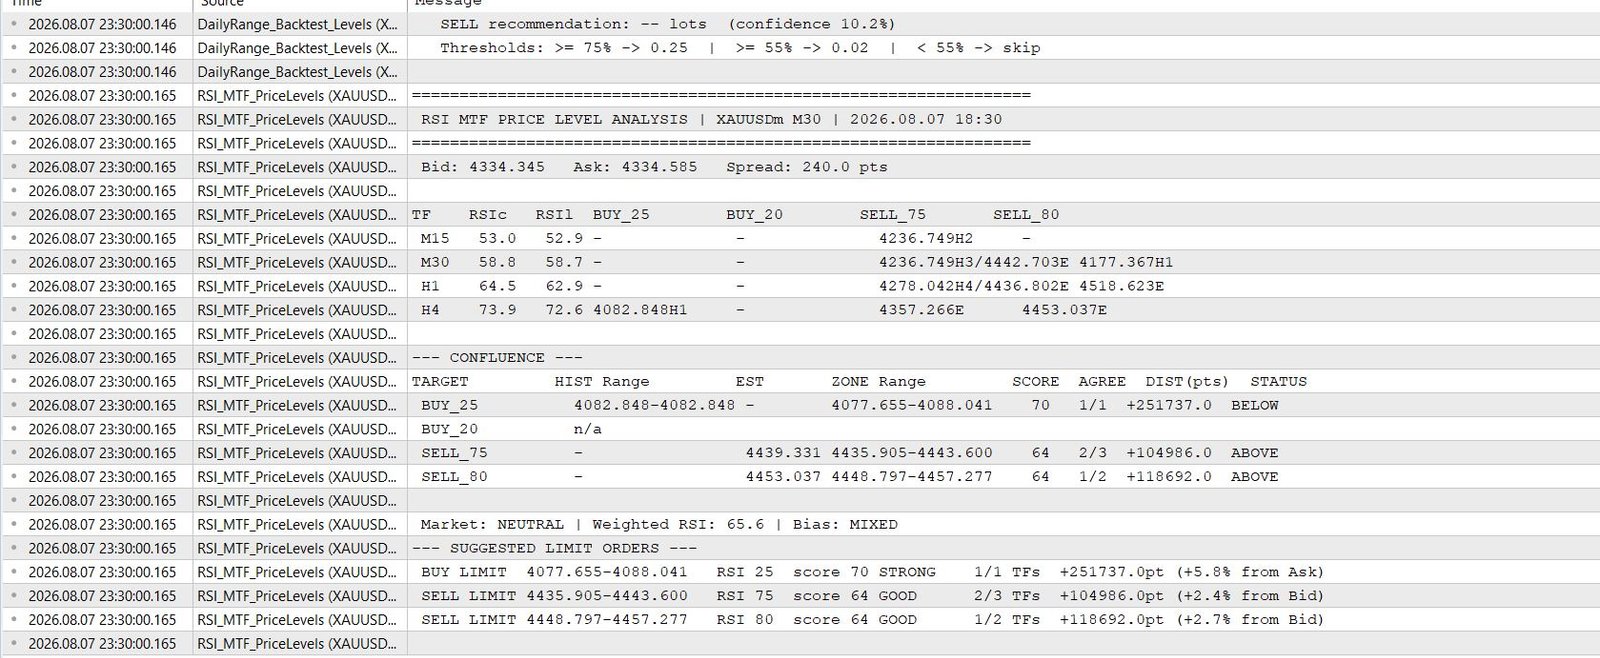
Once all four timeframes produce their historical and estimated levels for each target (Buy 25, Buy 20, Sell 75, Sell 80), the confluence engine combines everything into a single 0-100 score. Seven independently weighted components determine the final score:
- TF Agreement (25%): How many of the 4 timeframes point to the same price region
- Historical Strength (15%): Crossing frequency weighted by timeframe importance
- Clustering Tightness (15%): Price dispersion within the cluster relative to tolerance
- Hist/Est Agreement (15%): Distance between historical and estimated projection centers
- Higher-TF Weight (15%): H1 and H4 contribution share (higher TFs carry more weight)
- Distance Band (10%): How far the level is from current market price
- RSI Extremeness (5%): Proximity of current RSI to the target threshold
Final score labels: WEAK (≤30) → MODERATE (≤50) → GOOD (≤70) → STRONG (≤85) → VERY STRONG (>85)
On-Chart Visualization
Historical levels: solid lines with labels showing timeframe, RSI threshold, price, and occurrence count. Estimated levels: dashed lines with "(PAST)" marker if current RSI already crossed the threshold. Confluence zones: gold dash-dot lines with semi-transparent rectangles (green = buy zone, red = sell zone). Per-timeframe zone rectangles (optional). Invalid-side levels automatically render as dotted grey.
Dashboard + Live Market State
The on-chart dashboard displays: per-timeframe table with closed RSI, live RSI (updates every tick via ForwardRSI), and estimated price levels with validity markers (A/B = valid above/below, N = near current price, I = invalid side, P = already past). Confluence section: HIST range, EST center, ZONE bounds, SCORE, AGREEMENT count, DISTANCE from market in points/pips/%. Market state (weighted MTF RSI), overall bias (buy/sell/mixed), and strongest buy/sell zones with scores.
Pair It with Daily Range Backtest
This indicator tells you WHERE to place limit orders (exact RSI-based price levels). The Daily Range Backtest indicator tells you HOW LIKELY those orders are to fill and hit TP — using causal walk-forward validation with H1+H4 bar-by-bar simulation. Together, they form a complete trade planning system.
Get the Source Code — $130 for Both Indicators
RSI_MTF_PriceLevels.mq5 (2,028 lines) + DailyRange_Backtest_Levels.mq5 (754 lines). Full source code. Commercial use included.
Buy Source Code — $130Quick FAQ
Does this indicator repaint?
No. Method A uses closed bars only. Method B projections are fixed at bar close. Chart levels only update on new bar per-timeframe.
RSI 22 vs RSI 14 — why 22?
RSI(22) produces ~40-60% fewer crossings, generating higher-quality signals for limit order placement. Fully configurable.
Which timeframe should I attach it to?
Any timeframe. The indicator always uses its own M15/M30/H1/H4 data. Your chart timeframe doesn't affect it.
Choose the next useful step
Most visitors arrive with one question: build, test, price, or trust. These shortcuts keep the path practical.
Go deeper before you build, download or automate
Hand-picked engineering articles, indicator breakdowns and trading-system tools so visitors keep exploring instead of leaving after one page.

Pine Script to MT4/MT5 Conversion Planner
Analyze Pine strategies, repainting risk, TradingView alert bridges, MTF synchronization and the correct MQL4/MQL5 build path before paying for conversion.
Open planner
3-in-1 MT5 Indicator Bundle
12H Bias Engine, Smart Money Institutional Flow Dashboard and D1/H1 pending-signal logic with MQ5 + EX5 source included via Etsy.

MT5 Bank Orders Institutional Flow Dashboard
Supply/demand zones, BOS/CHoCH, liquidity levels, FVG, equal highs/lows and confirmed trade-plan logic explained with EX5 download.

MT5 Asia London NY Liquidity Engine
Asia range, London raid and New York continuation/reversal planning with internal session backtest stats and entry/SL/TP dashboard.

Interactive Brokers RSI Pair Trader
Tkinter desktop trading workflow, TWS API connection handling, RSI pair logic, risk controls and custom IBKR development positioning.

XAUUSD M30 CSV Data For Backtesting
Use clean MT5 historical data for Python backtests, strategy validation, spread checks and realistic gold EA research workflows.