Volume Footprint Indicator for MT5
Every candle becomes a two-sided order-flow map: bid volume on the left, ask volume on the right, at every price row — with delta, session CVD, 300% imbalances, stacked zones, absorption/exhaustion/divergence patterns and a BUY / SELL / WAIT signal with SL and TP in pips.
The Indicator on GBPJPY (H4)
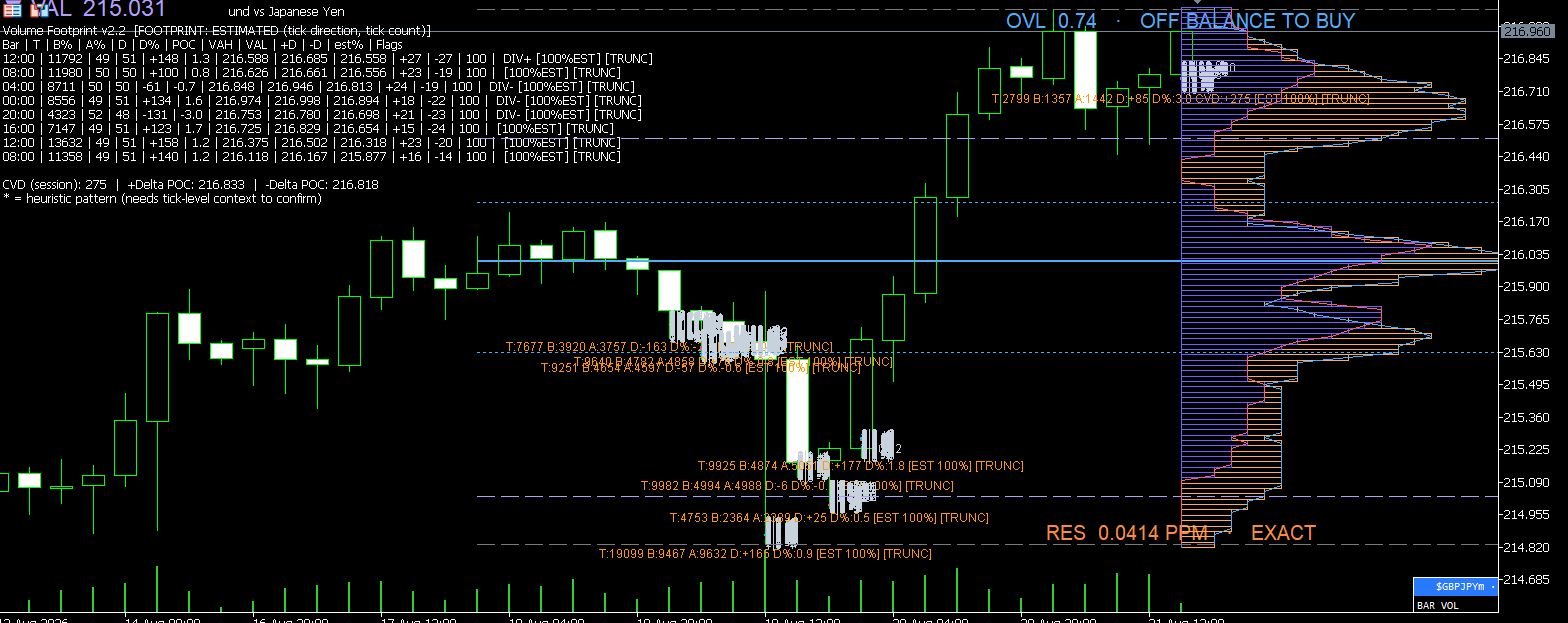
What It Measures
| Feature | What It Tells You |
|---|---|
| Bid/Ask per row | Seller volume (left, red) vs buyer volume (right, blue) at every price level of every candle |
| Delta (per level + per bar) | Ask minus Bid — who is winning at that exact price, and across the bar |
| Session CVD | Cumulative delta of the session (daily reset) — the market running vote |
| Diagonal imbalances | 300% default: buy row vs sell row below (or vice versa) — blue/red lines marking overpowered levels |
| Stacked imbalances | 3+ consecutive same-side imbalances — committed aggressive volume zones that defend on retests |
| Patterns | ABS+/- (absorption), EXH-H/L (exhaustion), DIV+/- (3-bar delta divergence) in the table panel |
| Signal engine | Prints BUY / SELL / WAIT to the Experts tab with SL and TP in pips (SL = VAL for buys / VAH for sells) |
| TRUE / ESTIMATED label | Honest data-mode banner: real trade tape vs tick-direction estimation, per bar |
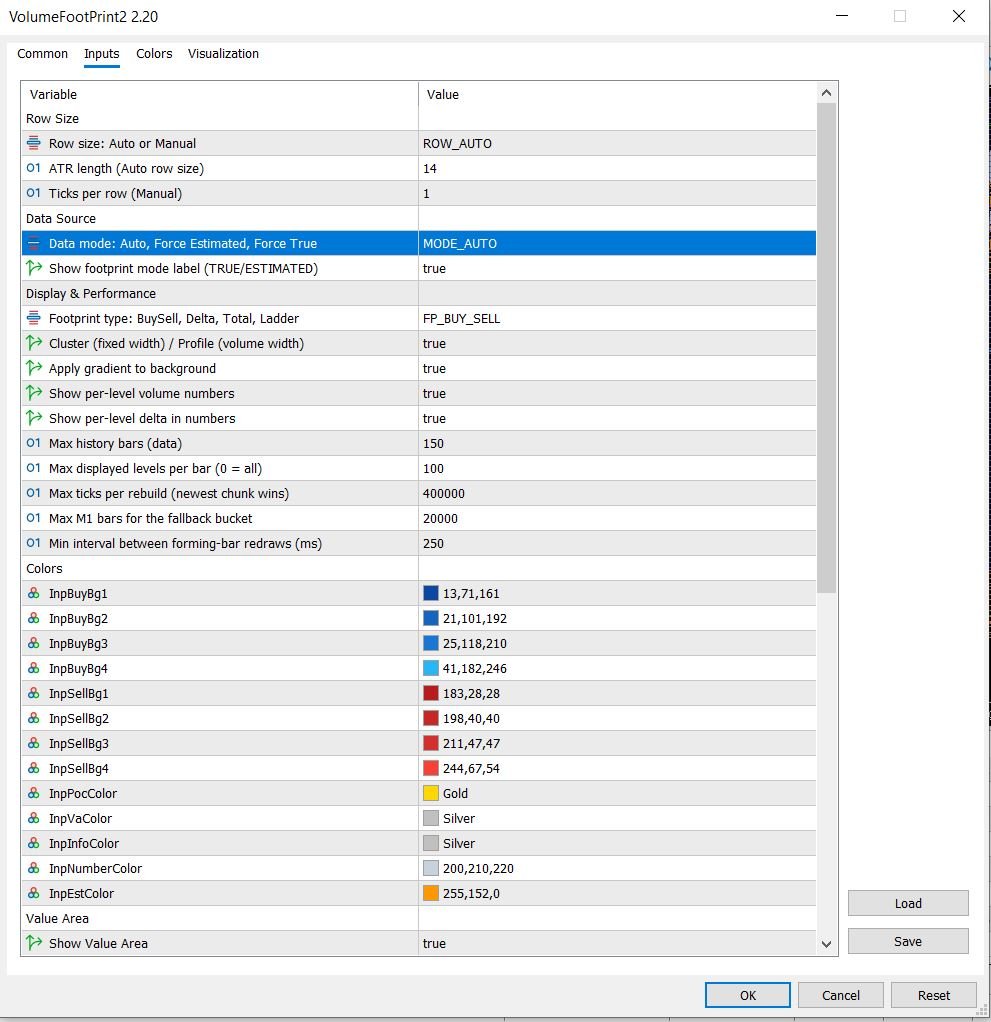
Input Parameters — How to Set Them
| Input | What It Does | Recommended |
|---|---|---|
| Row Size (Auto/Manual) | Auto = 0.2×ATR row height; Manual = fixed ticks | Auto |
| ATR Length / Ticks Per Row | Smoothing for auto rows; manual row size | 14 / 1 |
| Data Mode | Auto / Force Estimated / Force True — controls tick classification | Auto |
| Footprint Type | BuySell / Delta / Total / Ladder cell modes | BuySell |
| Show Numbers / Level Delta | Per-row bid|ask text and ±delta | On |
| Max Bars / Max Levels | History depth and displayed rows (display-only limit) | 150 / 100 |
| Value Area % / POC | Per-bar value area and Point of Control | 70 / On |
| Imbalance % | Diagonal dominance ratio for imbalance detection | 300 |
| Min Dominant / Min Ref Vol | Volume floors so tiny rows cannot fake an imbalance | 0 (off) / 0 |
| Stacked Count | Consecutive imbalance rows needed for a stacked zone | 3 |
| Signal (Experts print) | BUY/SELL/WAIT line with SL/TP/R:R | On |
| Alerts | New/stacked imbalance, absorption, exhaustion, divergence alerts | Stacked on, rest off |
How to Use It
- At the current price: read the row — Ask > Bid = buyers in control, Bid > Ask = sellers. Check the delta sign in the info line.
- Triggers: blue imbalance line near price = long trigger; red = short. Stacked zones act as targets and reaction levels.
- The signal line prints BUY/SELL/WAIT with SL and TP in pips — follow it for execution discipline.
- ESTIMATED mode (brokers without trade tape): halve position size — the [EST%] tag tells you how much of the bar is estimated.
- Combine with the Volume Profile indicator for the macro bias before taking footprint triggers.
Complete usage: read the footprint guide and the 25 confluence setups article.
FAQ
Is the volume footprint indicator free?
Yes — the ex5 is free. Source code is available through the contact page.
What is delta in a footprint chart?
Ask volume minus Bid volume. Positive delta means aggressive buyers dominated that row or bar; negative means aggressive sellers did.
What is a 300% imbalance?
A price row where one side of volume is at least 3 times the opposing side of the neighboring row, measured diagonally — the classical footprint imbalance threshold.
What does ESTIMATED mode mean?
Your broker does not publish real trade tape, so the indicator estimates buy/sell from tick direction — honestly labeled per bar with the [EST%] tag. TRUE mode appears automatically on brokers with real flags.
How accurate are the BUY/SELL signals?
They reflect order-flow context at the current price — row delta, bar delta, CVD and value-area position. They are decision support, not a guarantee; always keep the printed SL/TP discipline.
Complete the Order-Flow Pair
Choose the next useful step
Most visitors arrive with one question: build, test, price, or trust. These shortcuts keep the path practical.
Go deeper before you build, download or automate
Hand-picked engineering articles, indicator breakdowns and trading-system tools so visitors keep exploring instead of leaving after one page.

Pine Script to MT4/MT5 Conversion Planner
Analyze Pine strategies, repainting risk, TradingView alert bridges, MTF synchronization and the correct MQL4/MQL5 build path before paying for conversion.
Open planner
3-in-1 MT5 Indicator Bundle
12H Bias Engine, Smart Money Institutional Flow Dashboard and D1/H1 pending-signal logic with MQ5 + EX5 source included via Etsy.

MT5 Bank Orders Institutional Flow Dashboard
Supply/demand zones, BOS/CHoCH, liquidity levels, FVG, equal highs/lows and confirmed trade-plan logic explained with EX5 download.

MT5 Asia London NY Liquidity Engine
Asia range, London raid and New York continuation/reversal planning with internal session backtest stats and entry/SL/TP dashboard.

Interactive Brokers RSI Pair Trader
Tkinter desktop trading workflow, TWS API connection handling, RSI pair logic, risk controls and custom IBKR development positioning.

XAUUSD M30 CSV Data For Backtesting
Use clean MT5 historical data for Python backtests, strategy validation, spread checks and realistic gold EA research workflows.