Volume Profile Order Flow Indicator for MT5
The complete volume profile machine: two bell curves of buy and sell volume beside your chart, POC, Value Area, an overlap coefficient (OVL) that tells you if the market is balanced or directional, and a footprint table at the current price. Free ex5 download.
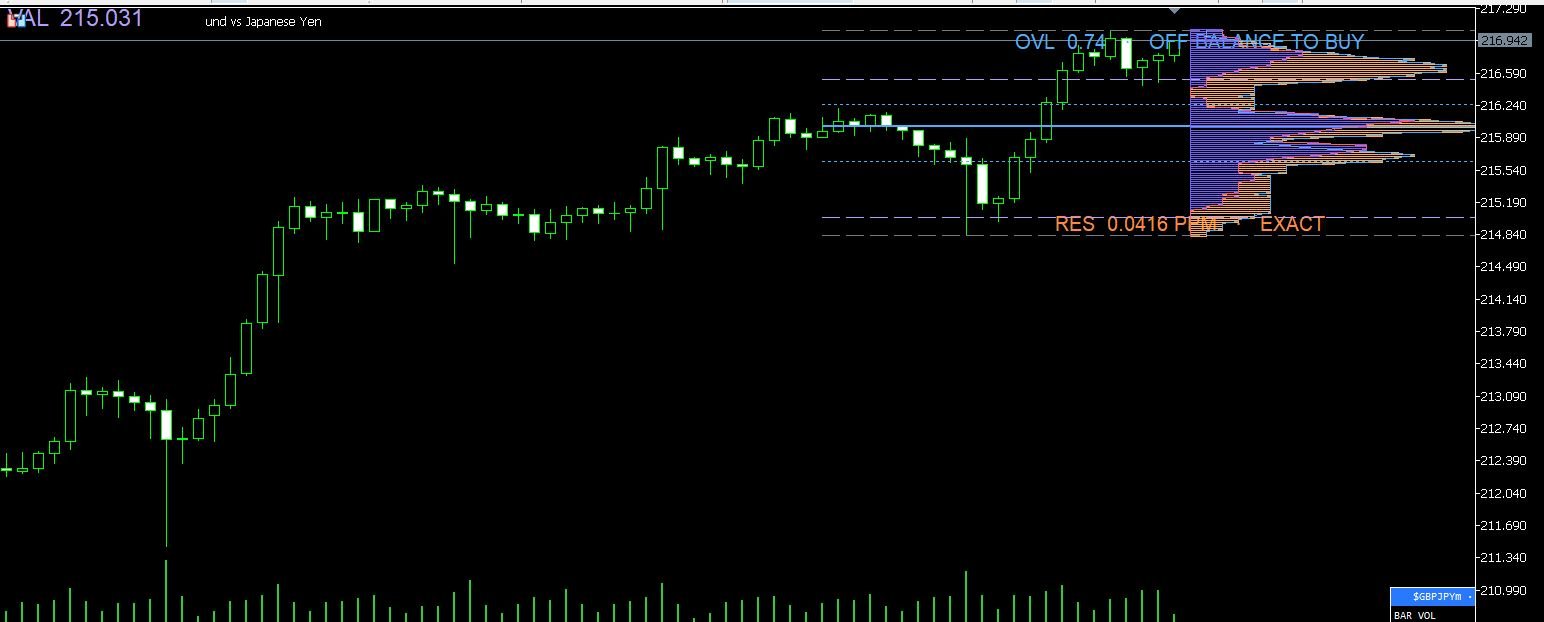
The Indicator on GBPJPY (H4)
What It Measures
| Feature | What It Tells You |
|---|---|
| Buy / Sell profile bells | Where the period's buying and selling volume actually traded, as two bell curves beside price |
| POC (Point of Control) | The price where the most volume changed hands — the market's magnet |
| VAH / VAL (Value Area) | The band holding your chosen % of traded volume (70% default) — the accepted price zone |
| OVL (Overlap) | 0-1 score of how much buy and sell volume happened at the SAME prices. Near 1 = balanced/rotating; far from 1 = directional |
| Balance Tilt | Which side carried more volume, in % points of the period's total |
| Footprint table | Bid/ask volume per price row around the current price, with POC/VAH/VAL/imbalance markers |
| Residual PPM check | Built-in math health check: EXACT = profile drawing is faithful to the data; DRIFT = do not trade off it |
Input Parameters — How to Set Them
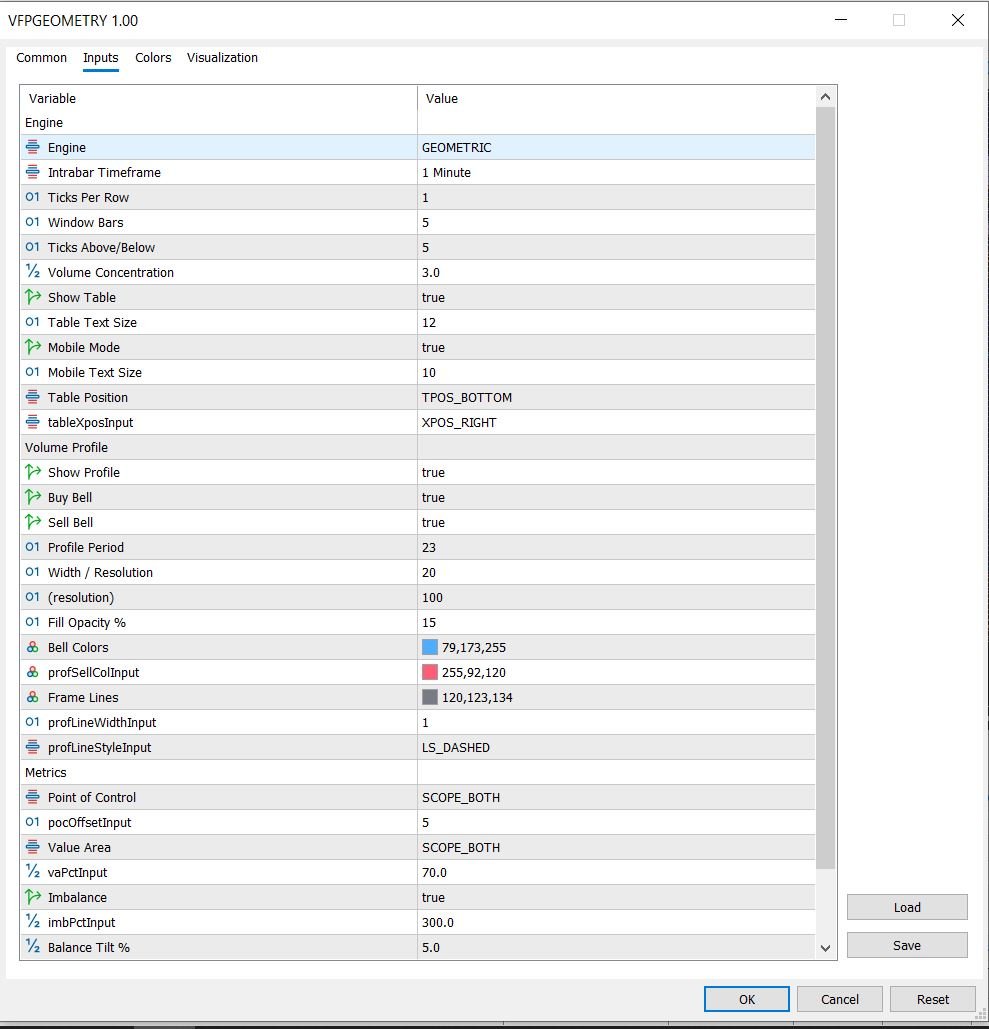
| Input | What It Does | Recommended |
|---|---|---|
| Engine | Volume source: Geometric (Gaussian split by close position), Intrabar (lower-timeframe up/down), Footprint (real tape where broker provides it) | Geometric (works everywhere) |
| Intrabar Timeframe | Lower timeframe the Intrabar engine reads from | M1 |
| Ticks Per Row | Row height of the footprint table in ticks (1 = finest) | 1 for forex, 10+ for gold |
| Window Bars | How many recent candles the footprint table shows | 5 |
| Ticks Above/Below | Rows shown around the current price (the altimeter frame) | 5-10 |
| Volume Concentration | How tightly volume gathers around bar centers (lower = spread out) | 3.0 |
| Profile Period | How many bars feed the profile bells | 23 for H4 session view |
| Fill Opacity % | Bell body transparency; overlaps blend automatically | 15 |
| POC / Value Area scope | Where POC/VA are marked: Dashboard, Chart, or Both | Both |
| Value Area % | % of traded volume the VA band must contain | 70 (classical) |
| Imbalance % | Diagonal ratio for imbalance marks in the table | 300 |
| Balance Tilt % | Min tilt before the OVL label names a side | 5 |
| Residual Tolerance PPM | Drift limit before EXACT flips to DRIFT | 1.0 |
How to Use It
- Balanced market (OVL ≥ 0.75): fade the edges — buy VAL, sell VAH, target POC.
- Directional market (OVL low + tilt names a side): follow — buy pullbacks above POC, sell rallies below it.
- Pair it with our Volume Footprint indicator for entry timing — this one gives the bias, that one gives the trigger.
- If the label ever reads DRIFT, the profile math is out of tolerance — stand aside until it returns to EXACT.
Full strategy breakdown: read the volume profile guide and the 25 confluence setups article.
FAQ
Is the volume profile indicator free?
Yes — the ex5 is a free download. The source code is available on request through the contact page.
What is OVL on a volume profile?
The overlap coefficient: how much buy and sell volume happened at the same prices, from 0 to 1. Near 1 = balanced rotation; far from 1 = directional market with one side in control.
Which engine should I choose?
Geometric works on every broker and is the safe default. Intrabar reads real up/down volume from a lower timeframe. Footprint uses real trade tape only where the broker provides it.
What timeframes does it work on?
All of them. The profile is most meaningful on H1-H4-D1; the footprint table works on any intraday chart.
Does it work on gold?
Yes — for XAUUSD raise Ticks Per Row to 10 or more so rows match gold's larger tick structure.
Get the Complete Pair
Choose the next useful step
Most visitors arrive with one question: build, test, price, or trust. These shortcuts keep the path practical.
Go deeper before you build, download or automate
Hand-picked engineering articles, indicator breakdowns and trading-system tools so visitors keep exploring instead of leaving after one page.

Pine Script to MT4/MT5 Conversion Planner
Analyze Pine strategies, repainting risk, TradingView alert bridges, MTF synchronization and the correct MQL4/MQL5 build path before paying for conversion.
Open planner
3-in-1 MT5 Indicator Bundle
12H Bias Engine, Smart Money Institutional Flow Dashboard and D1/H1 pending-signal logic with MQ5 + EX5 source included via Etsy.

MT5 Bank Orders Institutional Flow Dashboard
Supply/demand zones, BOS/CHoCH, liquidity levels, FVG, equal highs/lows and confirmed trade-plan logic explained with EX5 download.

MT5 Asia London NY Liquidity Engine
Asia range, London raid and New York continuation/reversal planning with internal session backtest stats and entry/SL/TP dashboard.

Interactive Brokers RSI Pair Trader
Tkinter desktop trading workflow, TWS API connection handling, RSI pair logic, risk controls and custom IBKR development positioning.

XAUUSD M30 CSV Data For Backtesting
Use clean MT5 historical data for Python backtests, strategy validation, spread checks and realistic gold EA research workflows.