Pullback vs Breakout Entry — The Honest Comparison
Geometry, fill rates, expectancy per setup, spread costs on tight stops, and the regime where each style earns its keep. No anecdotes — arithmetic.
The argument runs forever in trading forums: chase the breakout, or wait for the pullback? Each side quotes its best trade as evidence. This article settles it the only way it can be settled — with the full arithmetic of both entries on the same move, including the numbers the debate usually omits: fill probability and the cost of tight stops. By the end you will know which style fits your instrument, your regime and your temperament — and why the professional answer is usually "both, with rules for each".
What Each Entry Actually Is
| Breakout entry | Pullback entry | |
|---|---|---|
| Order type | Stop order beyond the level (buy stop above resistance / sell stop below support) | Limit order at the retracement destination, or market on a trigger close |
| Fills when | Price trades through the level — entering WITH expansion | Price returns to the destination and shows a trigger — entering WITH contraction ending |
| Assumption | The break is real and momentum continues | The counter-move is temporary and structure holds |
| Failure mode | False break: the level is reclaimed and the stop is hit | No retrace: the move leaves without you; or the pullback becomes a reversal |
| Requires | Momentum regime; quick decision-making at the trigger | Patience; a defined destination and trigger; close-based invalidation |
The Geometry — Same Move, Full Arithmetic
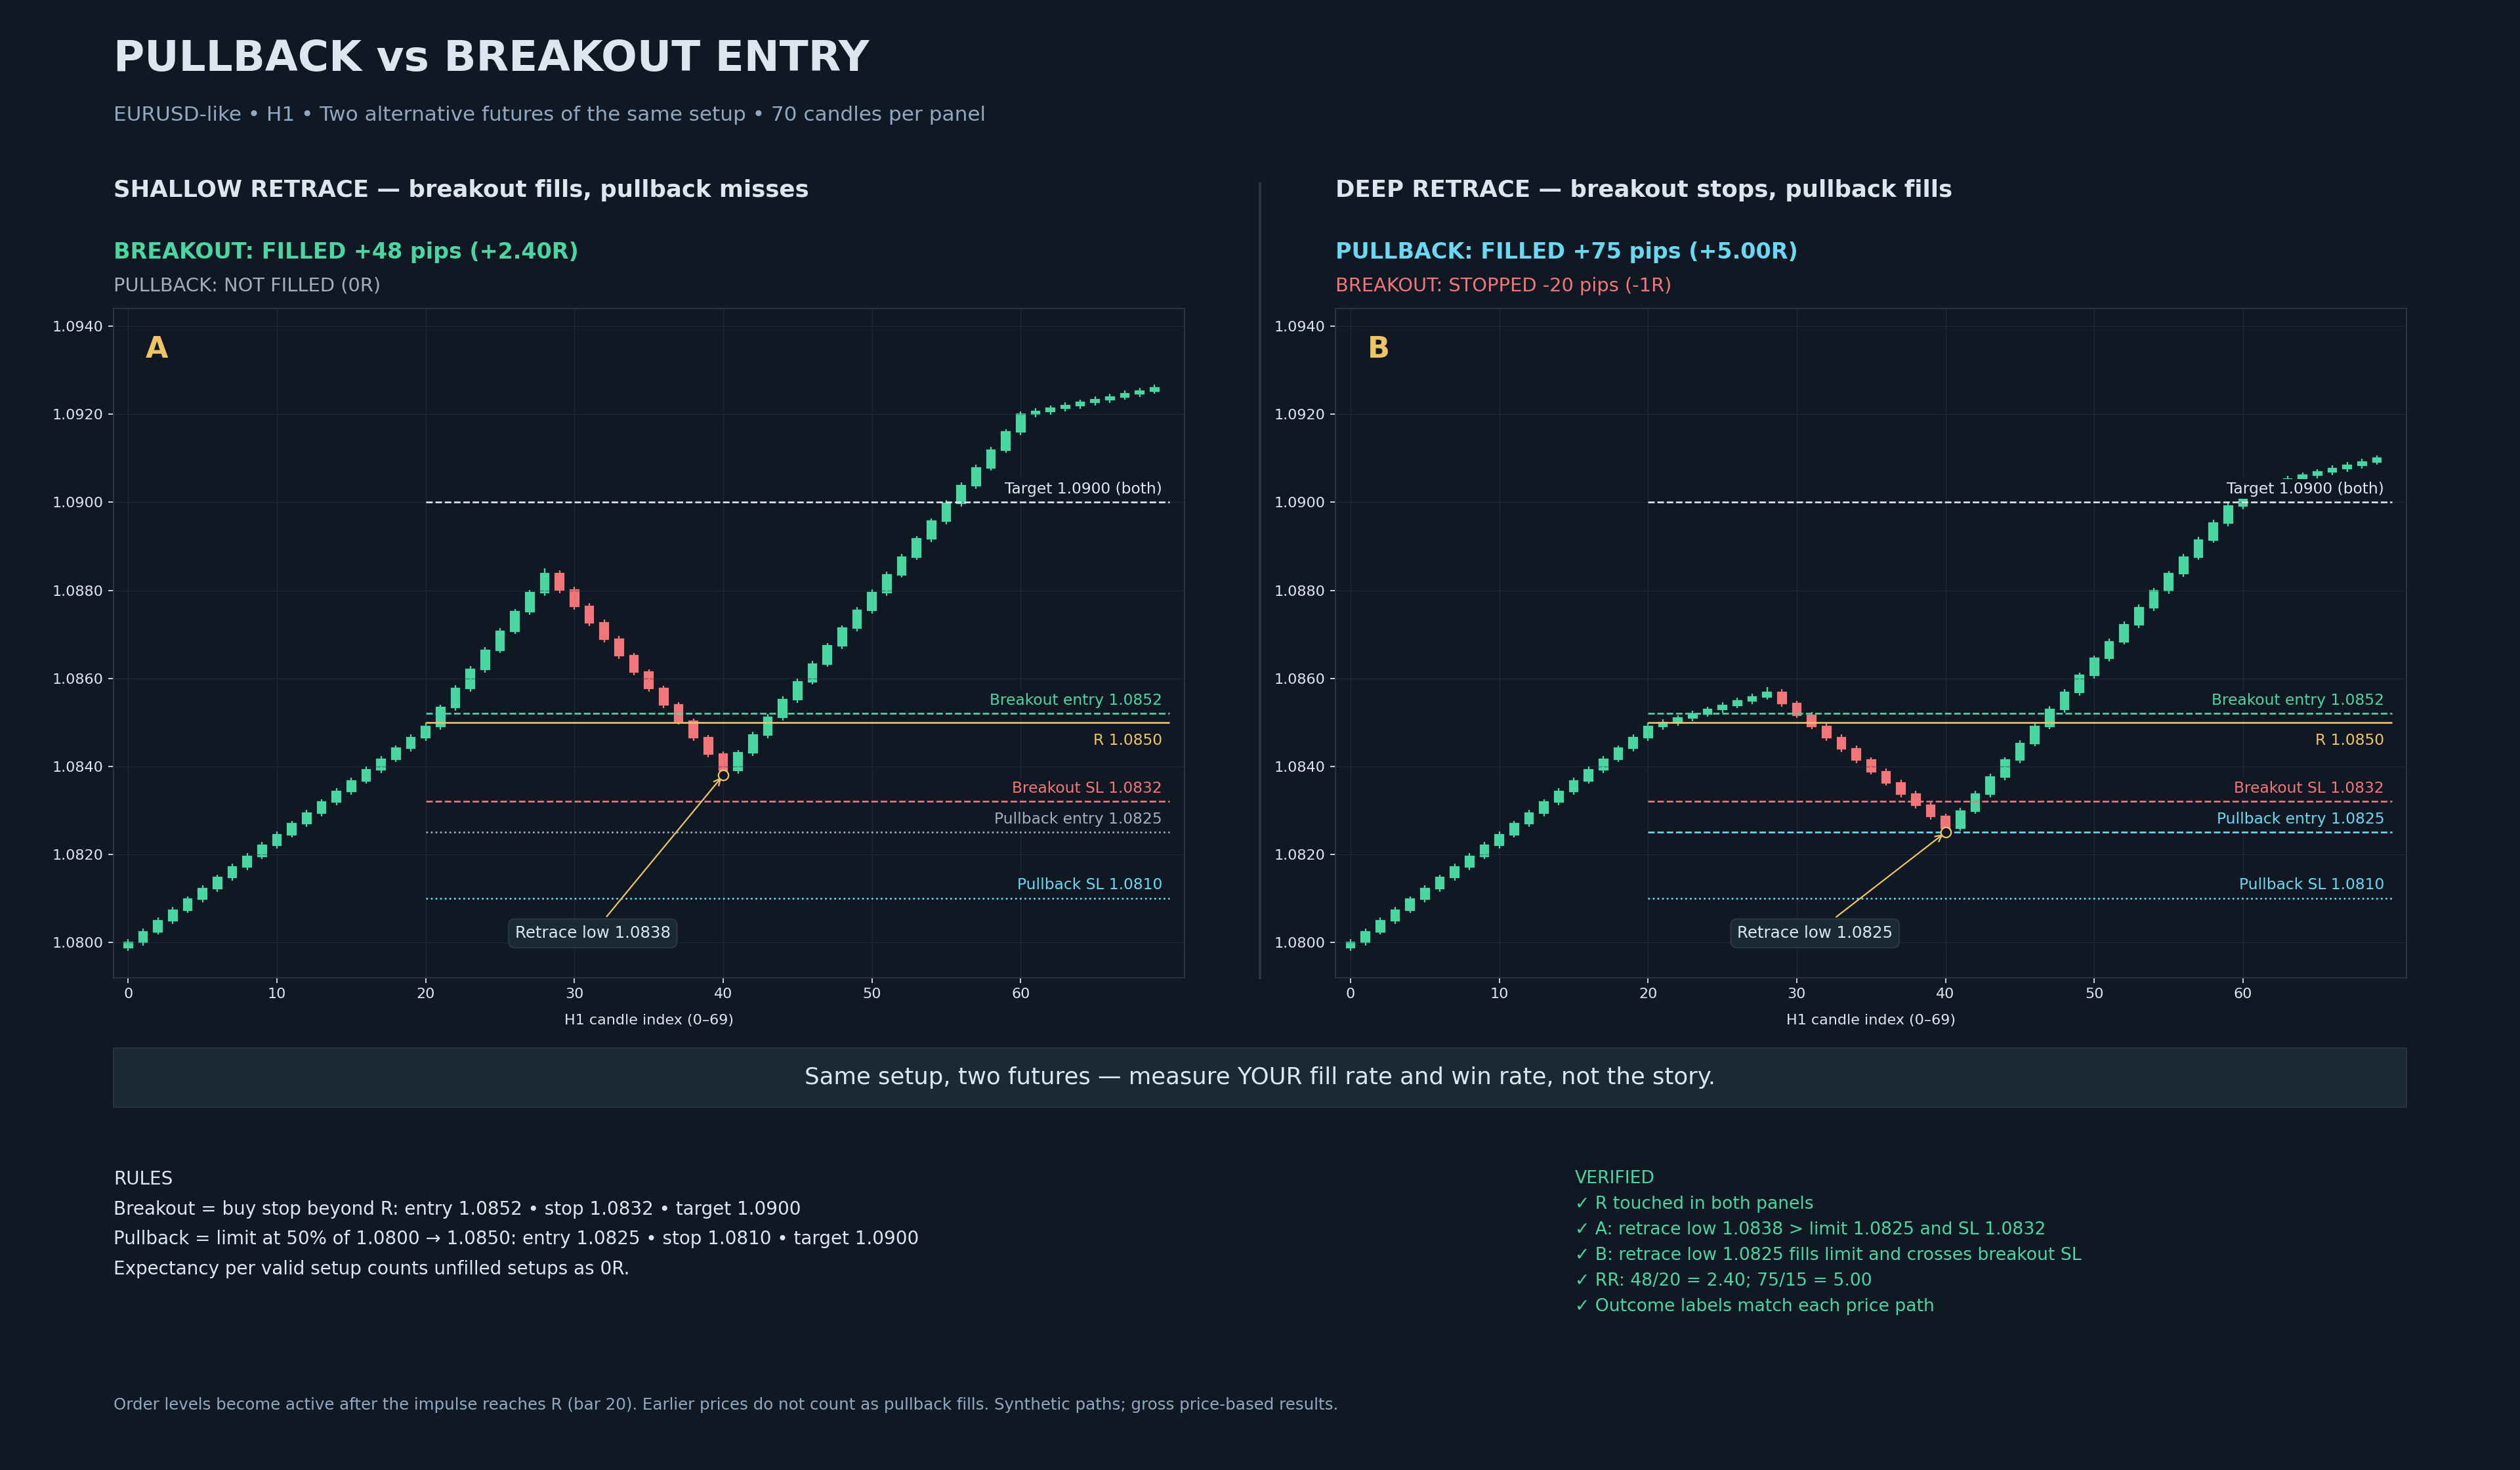
Take one scenario on EURUSD, used identically for both styles. Resistance R = 1.0850. Price builds an impulse from 1.0800 to R, breaks it, and — in the continuation scenario — runs to 1.0900.
$$RR=\frac{\text{Reward}}{\text{Risk}}$$
Breakout entry
- Buy stop placed at 1.0852 (2 pips beyond R, our standard buffer logic applied to breakout orders).
- Stop loss at 1.0832 — 20 pips below entry, sitting under the breakout structure.
- Target 1.0900 → reward = 48 pips.
- Reward-to-risk = 48 ÷ 20 = 2.40.
Pullback entry
- Price retraces to 1.0825 — the 50% level of the 1.0800→1.0850 impulse.
- Limit entry at 1.0825 (or market on the trigger close at the level).
- Stop loss at 1.0810 — 15 pips below entry, under the pullback structure.
- Target 1.0900 → reward = 75 pips.
- Reward-to-risk = 75 ÷ 15 = 5.00.
On geometry alone, the pullback wins decisively — more than double the reward-to-risk on the identical target, because the entry is closer to structure and the stop is tighter. This is the arithmetic pullback advocates quote, and it is correct. It is also incomplete, because it silently assumes the pullback trade happens. Price may never retrace to 1.0825. In that world, the pullback trader's result on this move is not +5R — it is zero.
Fill Probability — The Half of the Equation Nobody Quotes
Both styles have a "miss" that the other does not:
- The pullback misses when no retrace comes. In strong momentum regimes this is common — shallow pullbacks (23.6–38.2%) never reach the 50% limit, and the move leaves. The pullback trader watches a +5R move they were correct about produce 0R.
- The breakout "misses" nothing — it fills into failures. A stop order at the level fills in every break, including the false ones. Its miss is not unfilled trades; it is filled trades into immediate reversal.
The honest comparison therefore uses expectancy per valid setup — the average result across every setup your rules generated, counting unfilled setups as zero. Illustrative arithmetic (hypothetical win rates used to show the structure of the math — not claims about any strategy):
$$E_R=p_{win}\cdot W_R-(1-p_{win})\cdot L_R\qquad\text{(per valid setup; unfilled = 0R)}$$
| Style | Fill rate | Win rate of fills | Reward-to-risk | Expectancy per setup |
|---|---|---|---|---|
| Breakout | ~100% (fills whenever the level breaks) | 40% | 2.40 | 0.40×2.40 − 0.60×1.00 = +0.36R |
| Pullback | ~60% (retrace required) | 30% | 5.00 | 0.60×(0.30×5.00 − 0.70×1.00) = +0.48R |
Read the table's lesson, not its numbers: the pullback's geometry advantage survives the fill-rate penalty — but only if the geometry is real. If the pullback's actual reward-to-risk degrades (slippage on the trigger, a deeper stop because the destination was sloppy), the advantage evaporates. And if the breakout's win rate in your market is 50% rather than 40%, it wins the comparison outright. The conclusion is not "pullbacks are better". It is: the difference between the styles is a number you must measure on your own instrument — fill rate and win rate, logged over fifty setups. The structure of the math above is the template; your journal provides the inputs.
The Spread Cost Nobody Puts in the Geometry
The pullback's tighter stop has a hidden cost the geometry table ignores: the same spread is a larger fraction of a smaller risk. Round-trip costs as a percentage of the stop distance:
| Instrument | Round-trip spread | Breakout stop | Cost % of risk | Pullback stop | Cost % of risk |
|---|---|---|---|---|---|
| EURUSD | 1.0 pip | 20 pips | 5.0% | 15 pips | 6.7% |
| GBPJPY | 2.0 pips | 30 pips | 6.7% | 22 pips | 9.1% |
| XAUUSD | 3.0 pips | 40 pips | 7.5% | 28 pips | 10.7% |
Both styles pay; the pullback pays a higher tax rate per unit of risk. This does not reverse the earlier conclusion — the pullback's reward advantage is still larger than the cost delta — but it sharpens it: tighter is not automatically cheaper. A trader who scales pullback stops down further (to "improve" the ratio) increases the cost percentage and the sweep-hit probability simultaneously, which is how a mathematically beautiful setup becomes a donation. The stop belongs at structure plus buffer; the size belongs at the risk percentage. Those two rules, and only those.
The Regime Matrix — Where Each Style Earns Its Keep
| Regime | Breakout entries | Pullback entries |
|---|---|---|
| Trending / expanding | Thrive — continuation follows through, stop orders catch the acceleration | Struggle — pullbacks are shallow and fast; limits often unfilled |
| Ranging / contracting | Suffer — repeated false breaks consume stops at both boundaries | Work only as range logic (fade the edges), not as trend pullbacks |
| News / volatility shock | Work with the shock direction, but slippage on stop orders can be severe | Dangerous — the "pullback" is often the shock continuing; spreads widen exactly at the zone |
| Session-open impulses | Excellent — London/NY opens are the classic breakout window | Delayed — the first pullback of the session comes after the impulse, if at all |
The matrix explains most of the forum argument: each side remembers the regimes where their style dominated and forgets the others. The professional response is not to pick a side but to read the regime — expanding ranges and directional session opens favour breakouts; two-way overlapping flow favours pullbacks — and to hold both entry styles in the toolkit with pre-written rules for each.
The Hybrid — Breakout-Retest (The Flip)
There is a model that captures the breakout's evidence with the pullback's geometry: the breakout-retest, known in our series as the flipped level. Its logic: a level that breaks and then holds on the retest has demonstrated both things you wanted — the break was real (it survived), and the retrace came (you get the better entry). Its rules, from the verified chart in this series:
- Level: R = 1.0860, established by at least two prior rejection wicks within 1.5 pips.
- Breakout evidence: the first close above R — no entry yet.
- Retest: price returns; a bar's low comes within 0.3 × ATR14 above R without closing below it.
- Confirmation and entry: the next close above R and above the retest bar's close — market entry at that close.
- Stop: retest low minus the ATR-scaled buffer. Target: measured move R + (R − pre-breakout swing low).
- Invalidation: any close back below R after the retest.
The hybrid's honest cost: some moves never retest, so its fill rate sits between the two pure styles — but every fill carries breakout confirmation AND pullback geometry. For most traders on H1/H4 timeframes, this is the highest-quality single entry model in the family. The full rules with the verified example live in Support/Resistance Flip Pullback.
A second hybrid, for the momentum trader: enter the breakout, add on the first pullback. Entry one at the stop order (participation guaranteed), entry two at the first pullback that holds above the broken level (geometry added to a confirmed position). The rule set must state: maximum two entries, add size smaller than initial, combined risk still within the 1% budget, and both stops moved to structure after the add. Without those constraints the hybrid becomes averaging up into a blow-off — which is how momentum traders donate their best months.
The Psychology of Each Style — Pick With Your Temperament, Not Just Your Chart
Both entry styles are executable on paper; they are not equally executable by every person. The psychological demands are almost opposite, and ignoring that mismatch is why traders who "know" a style is superior still lose with it.
The breakout trader's burden
Breakout entries demand decisiveness under acceleration. The moment the stop order fills, the move is already moving, the spread is often at its widest, and hesitation is expressed as chasing or as abandoning the plan mid-fill. The breakout trader must also tolerate a specific pain: a meaningful share of fills reverse immediately, and the stop is taken fast. Sitting in that whipsaw without developing revenge patterns — without immediately re-entering the same level "to get it back" — is the entire psychological game. Traders who cannot watch a filled position die quickly should not run stop orders, no matter how good the backtest looked.
The pullback trader's burden
Pullback entries demand patience under absence. The setup is armed, the destination is marked, and nothing happens — sometimes for hours, sometimes the move leaves entirely. The pullback trader must tolerate watching correct analysis produce no trade, repeatedly, without loosening the entry criteria "just this once". The failure pattern is subtle: entries creep earlier and earlier (anticipating the destination), stops creep wider (accommodating the early entry), and the strategy silently becomes a breakout-chasing system with worse rules. Traders who cannot let a move leave without them should not run limit orders — the temptation to widen will beat them eventually.
The matching test is simple and honest: review your last twenty trades and count which failure you committed more often — entering too fast or entering too early. Too fast (chasing acceleration) points to breakout discipline as the skill to build first. Too early (anticipating levels) points to pullback discipline. Both are trainable; neither is trainable while trading the opposite style's entry mechanics.
Session and Time-of-Day Entry Selection
Regime is not only about trend versus range — the clock changes the regime within the day, and the entry-style matrix applies at session granularity too:
- Session opens (London, New York): the highest-probability breakout windows of the day. Impulses launch on volume, and stop orders beyond the opening range get the classic follow-through. Pullback limits placed during the open are usually either unfilled or filled at the worst point of the first retrace.
- Mid-session (the London–New York overlap lull, then the European close): two-way flow, contracting ranges — the classic pullback window. This is when limits earn their keep and stop orders earn their false breaks.
- Session close / fix: position squaring creates counter-flows that can retrace the day's last move into the following session — the gap-pullback window for instruments that gap (indices, stocks) and the overnight-retrace window for continuous markets.
Applied practically: a trader running both styles can schedule them — breakout rules active in the first 60–90 minutes of the two main sessions, pullback rules active in the hours between. That is not a compromise; it is the regime matrix applied at the resolution where regimes actually rotate. Our session clock maps the windows per instrument.
Partial Entries — Splitting the Difference With Rules
For traders who cannot choose — or who trade instruments where both styles are positive — the disciplined compromise is a split entry with pre-written rules for each half:
- Half position at the breakout: stop order beyond the level, standard ATR buffer for its stop.
- Half position at the pullback: limit (or trigger-close entry) at the defined destination — the flipped level, the EMA, the 50% zone.
- Rules that make it a system, not a hedge: combined risk of both halves ≤ 1% of account; each half carries its own stop at its own structure; if the pullback never comes, the breakout half stands alone (the trade is simply smaller); if the pullback comes but the breakout half was stopped, the pullback half is a fresh, independently-valid setup — enter it or not by its own rules, never as "revenge for the first half".
This structure captures the geometry of the pullback for half the position while guaranteeing participation with the other half — at the cost of being half-sized when either style alone would have been perfect. Expectancy per setup is typically similar to the better single style and the variance is lower, which matters more to some traders than the mean. The journal protocol from earlier tells you whether it matters to you: run the split for fifty setups and compare against your single-style columns.
One More Variable — How the Exit Interacts With the Entry
The two entry styles produce different kinds of positions, and managing them identically throws away part of each style's advantage:
Breakout entries are time-sensitive. You entered at the moment of maximum expansion; the thesis is "momentum continues now". If price stalls immediately — drifting sideways after the break instead of following through — the odds decay with every bar, because the fuel that launched the move (the stop cluster beyond the level) has already been consumed. The practical exit logic for breakout positions is therefore partly time-based: take the first partial at the nearest measured target, trail the remainder, and treat a fast return inside the broken level as the end of the thesis (a close back inside is the structural exit). Waiting patiently for a far target from a breakout entry is usually a misapplication — the trade's premise is speed, and speed either shows up or it does not.
Pullback entries are structure-sensitive. You entered at a destination with the invalidation a known, small distance away. The thesis is "the level holds and the trend resumes" — a condition that can be checked continuously against structure. That checkable invalidation is what lets pullback positions be held to structural targets and measured extensions without the anxiety that plagues breakout positions: if the thesis dies, you will know exactly when (the close beyond the zone), at a cost you sized for. The failure mode is equally defined: when that close comes, exit without negotiation, because the trade's entire safety came from the invalidation being honest.
Summarised as a rule: manage breakout positions against time; manage pullback positions against structure. Applying the pullback's patient-hold logic to a stalled breakout produces round trips; applying the breakout's fast-exit logic to a healthy pullback produces premature exits and re-entry churn. Each entry style's exit logic is part of the style — they are not interchangeable modules.
Deciding for Yourself — The Fifty-Setup Test
The only verdict that matters is the one your own data delivers. The protocol:
- Take the next fifty valid setups your rules generate (a valid setup = all context conditions met, both entry styles armed on the same event).
- Log for each: did the breakout fill? Did the pullback fill? Result of each fill in R. Unfilled = 0R.
- After fifty, compute expectancy per setup for both columns using the table structure above.
- Also log regime (trending/ranging) and session, so you can see if one style's edge is regime-concentrated.
Fifty setups across two or three instruments will produce a verdict personal enough to trade on and honest enough to trust. What it will almost certainly show: both styles are positive in their favourable regimes, both are negative outside them, and the regime read — not the style choice — is where most of the money is made or lost. That conclusion is boring, defensible, and worth the fifty setups.
FAQ
Is a pullback entry better than a breakout entry?
Neither is universally better — they are different products. Pullbacks offer better geometry with lower fill probability; breakouts fill reliably with wider stops and false-break exposure. Compare them by expectancy per valid setup, not reward-to-risk per filled trade.
What is expectancy per valid setup?
The average result per setup your rules generated, counting unfilled setups as zero. It punishes low fill rates and low win rates in one number — the honest denominator for the comparison.
Why do breakouts fail so often?
Obvious levels attract resting liquidity, including stops just beyond them. In ranging or contracting regimes, a push through a level is often just that liquidity being consumed — the level gets reclaimed and the breakout stop is hit. In genuine momentum regimes the same breaks continue.
Can I combine pullback and breakout entries?
Yes — the breakout-retest (flip) model combines breakout confirmation with pullback geometry; its cost is that some moves never retest. The "enter breakout, add on first pullback" hybrid works too, with strict rules on add size and combined risk.
Which entry style suits beginners?
Pullback entries with close-based invalidation: the trigger gives a defined moment, the stop sits at structure, and the patience requirement transfers to everything else. Breakouts demand faster decisions and tolerate less hesitation.
Should both entry styles use the same exit rules?
No. Breakout positions are time-sensitive (the premise is immediate continuation — if speed does not show, reduce), while pullback positions are structure-sensitive (hold to structural targets while the invalidation holds). Each style's exit logic is part of the style.
Continue the Series
- Pullback Trading Strategy — The Complete Guide (pillar)
- What Is a Pullback in Trading?
- Support/Resistance Flip Pullback
- Pullback or Reversal? How to Tell
- EMA Pullback Strategy
Both Entry Styles, Scanned Live
The Institutional Flow dashboard labels Buy Limit, Sell Limit, Buy Stop and Sell Stop plans across 50+ symbols — every order type in this article, running live.
Go from article to implementation
Read the proof, then test the idea with calculators, free tools, case studies and a fixed-price build path.
Go deeper before you build, download or automate
Hand-picked engineering articles, indicator breakdowns and trading-system tools so visitors keep exploring instead of leaving after one page.

Pine Script to MT4/MT5 Conversion Planner
Analyze Pine strategies, repainting risk, TradingView alert bridges, MTF synchronization and the correct MQL4/MQL5 build path before paying for conversion.
Open planner
3-in-1 MT5 Indicator Bundle
12H Bias Engine, Smart Money Institutional Flow Dashboard and D1/H1 pending-signal logic with MQ5 + EX5 source included via Etsy.

MT5 Bank Orders Institutional Flow Dashboard
Supply/demand zones, BOS/CHoCH, liquidity levels, FVG, equal highs/lows and confirmed trade-plan logic explained with EX5 download.

MT5 Asia London NY Liquidity Engine
Asia range, London raid and New York continuation/reversal planning with internal session backtest stats and entry/SL/TP dashboard.

Interactive Brokers RSI Pair Trader
Tkinter desktop trading workflow, TWS API connection handling, RSI pair logic, risk controls and custom IBKR development positioning.

XAUUSD M30 CSV Data For Backtesting
Use clean MT5 historical data for Python backtests, strategy validation, spread checks and realistic gold EA research workflows.