RSI Strategy Guide
RSI Indicator Strategy: Why 30/70 Fails Without Regime Context
The Relative Strength Index is useful, but the beginner interpretation is incomplete. RSI above 70 is not always a sell, RSI below 30 is not always a buy, and RSI divergence can fail hard when volatility and regime context disagree.
The Real RSI Question
The normal RSI formula compares average gains and losses over a lookback period, commonly 14 bars. That creates a 0-100 oscillator. The problem is not the formula. The problem is assuming one interpretation works across every symbol, session, volatility state, and market regime.
A better RSI strategy asks five questions before taking a trade: is this RSI rare for this market, is it rare for this volatility state, what did similar states do next, is oversold reversing or accelerating downward, and what regime is the market currently in?
Six Layers Of A Stronger RSI Strategy
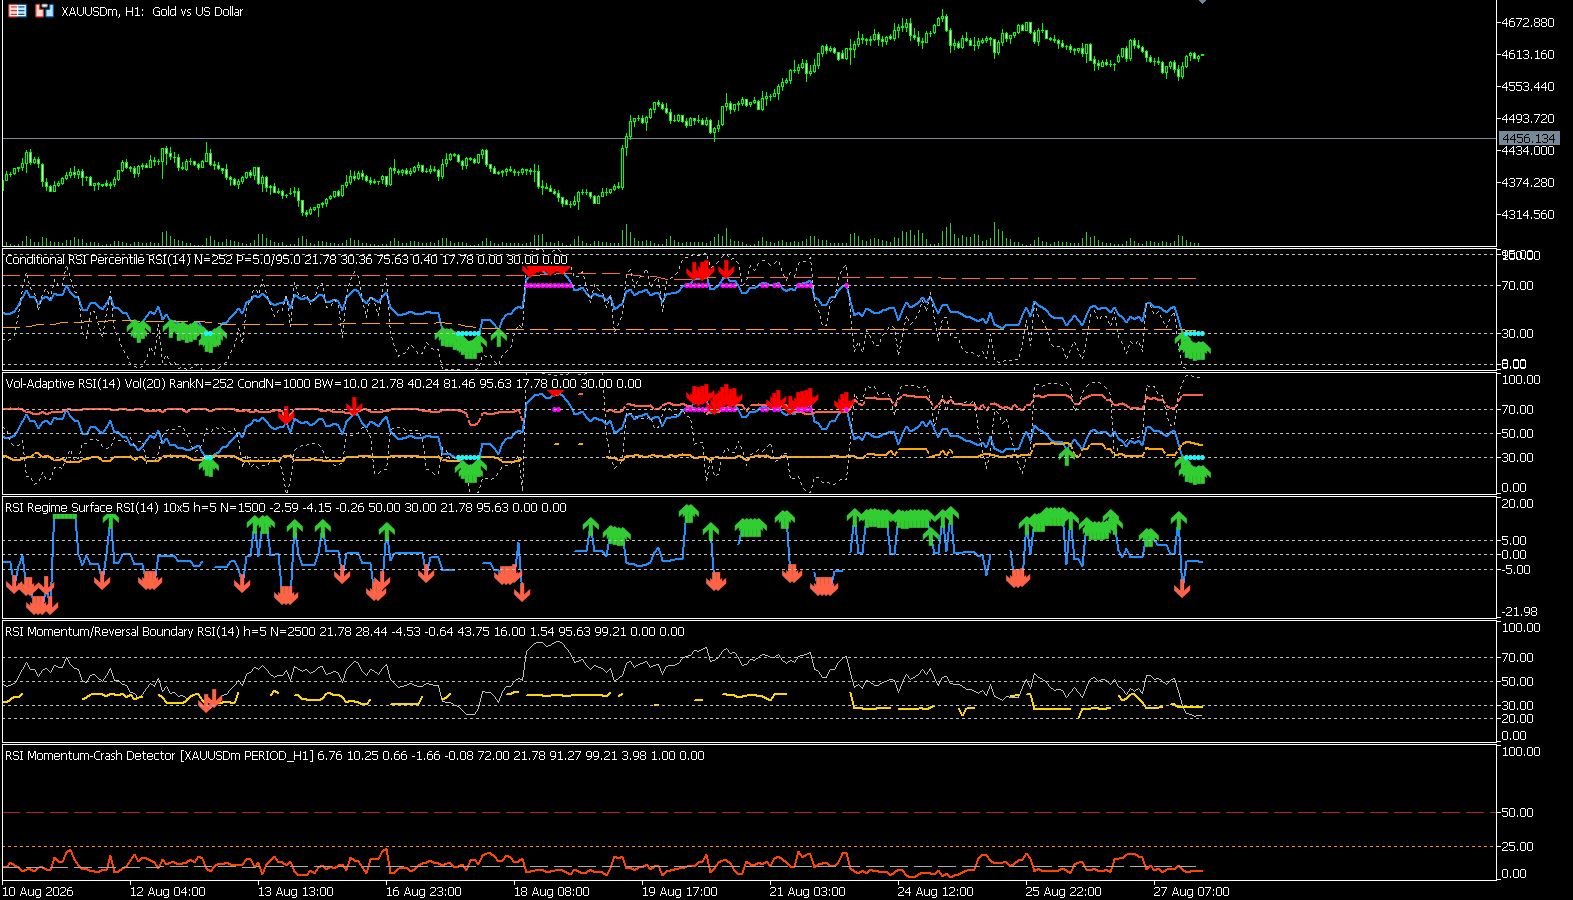
Conditional RSI Percentile
Use it as the first filter in the suite: if RSI is below 30 but not in the empirical lower tail, the move may be normal for that market. If RSI is only 36 but already in the 5th percentile, the chart may be more stretched than a standard RSI panel suggests.
Volatility-Adaptive RSI Thresholds
Use it after the percentile tool: the first asks "is RSI extreme for this market?" while this one asks "is RSI extreme for this volatility regime?"
RSI Regime Surface
This is the evidence layer. Instead of saying "RSI below 30 is buy," it asks what happened after comparable RSI and volatility states on this symbol.
RSI Oversold Momentum/Reversal Boundary
This is the answer to a high-value RSI question: "Is RSI below 30 a buy or sell signal?" The honest answer is conditional, and this page gives users a framework for making that call.
RSI Momentum-Crash Detector
This is useful for gold and index traders because the worst RSI readings often happen near the most emotional candles. It does not call bottoms blindly; it compares current stress with prior stress.
Hidden-Markov RSI
This is the "context brain" of the suite. It helps explain why the same RSI value can be bullish in one state, dangerous in another, and meaningless in chop.
RSI Above 70: Buy Or Sell?
RSI above 70 can signal exhaustion in a range, but it can also confirm strong upside momentum in a trend. The difference is context. In a quiet range, the percentile and volatility-adaptive tools may flag a real upper tail. In a bull HMM state with positive regime-surface expectancy, fading RSI 70 can be low quality.
That is why the cluster does not force one answer. It gives traders a repeatable decision map: percentile rarity, volatility conditioning, forward expectancy, and regime probability.
RSI Below 30: The Dangerous Signal
RSI below 30 is the signal that hurts many traders because the candle often looks cheap while the market is still repricing risk. The momentum/reversal boundary indicator directly targets this problem by estimating where low RSI historically shifts from downside continuation to mean reversion.
The crash detector is a separate layer. It looks for stressed states where rebound probability rises above baseline after drawdown and volatility have already expanded.
Best RSI Settings
RSI 14 is a useful default because it is widely watched, but "best" depends on the market and goal. Scalpers may need faster periods, swing traders may prefer slower periods, and research tools should expose whether the chosen period has repeatable expectancy. The six downloads default to RSI 14 because it keeps the results interpretable while still allowing deeper conditioning.
Download The MT5 RSI Research Cluster
All six tools are available as compiled MT5 indicators. They are free to test and designed for research, signal filtering, and strategy development. Source code is not included in the free downloads.





