Free MT5 RSI Research Indicator
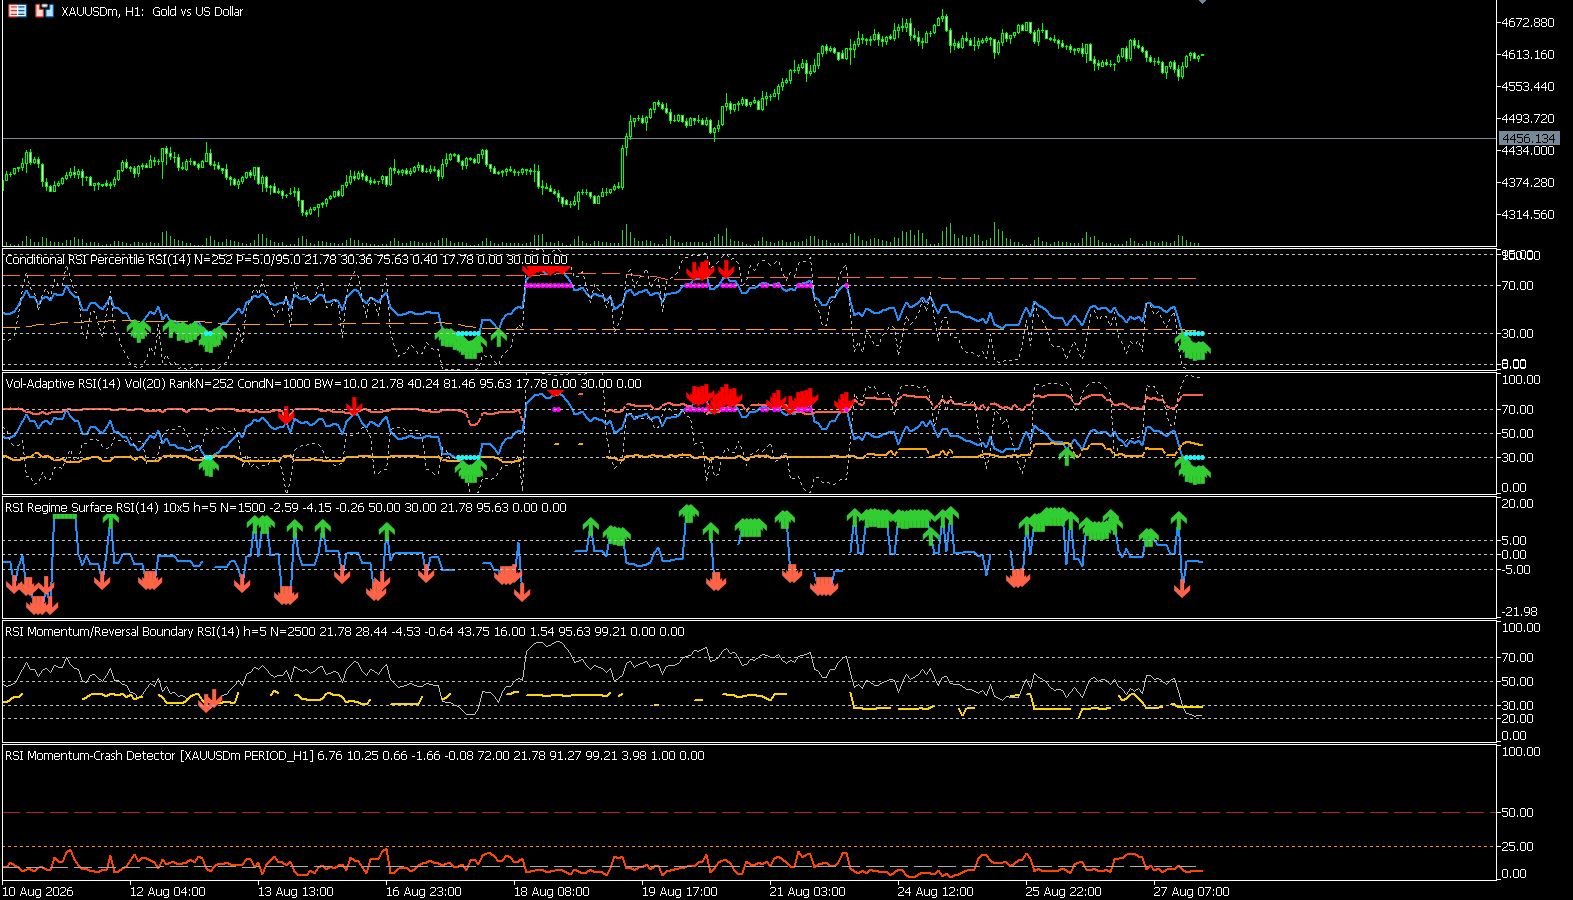
Conditional RSI Percentile for MT5
RSI is not really 0-100 in every market. This tool shows where the symbol historically treats RSI as extreme.
Compiled file only. Install in MQL5/Indicators. Source code is not included.
What It Solves
Finding adaptive RSI overbought and oversold zones when classic 30/70 signals fire too early.
Use it as the first filter in the suite: if RSI is below 30 but not in the empirical lower tail, the move may be normal for that market. If RSI is only 36 but already in the 5th percentile, the chart may be more stretched than a standard RSI panel suggests.
Technical Method
The indicator uses Wilder RSI, then ranks each RSI reading only against prior RSI observations. The lower and upper tails default to 5% and 95%, so the threshold moves with the symbol, timeframe, and recent behavior instead of assuming that 30 and 70 are always meaningful.
How This Indicator Works In Practice
Conditional RSI Percentile keeps the familiar RSI line, but it adds a second question: where does the current RSI sit inside its own recent distribution? A 32 RSI on one symbol can be ordinary, while a 38 RSI on another can be historically rare. This indicator makes that difference visible.
The rolling lookback is out-of-sample by design. Each bar compares current RSI against prior RSI observations, then plots dynamic quantile bands and percentile-tail signals. This makes it useful for traders who want adaptive RSI overbought and oversold zones without hiding the classic 30/70 benchmark.
Input Parameters Explained
| Input | Default | Meaning | Tuning Guidance |
|---|---|---|---|
InpRSIPeriod |
14 | Wilder RSI calculation period. | Use 7-10 for fast scalping, 14 for standard intraday work, 21-28 for slower swing filters. |
InpAppliedPrice |
PRICE_CLOSE | Price source used by the RSI calculation. | Close is best for most users. Typical price can be tested on noisy symbols. |
InpLookback |
252 | Number of prior RSI observations used for the empirical distribution. | 100-150 adapts faster for scalpers. 252 suits day traders. 500+ is slower and more stable for swing traders. |
InpLowerPercentile |
5.0 | Lower tail percentile used for oversold rarity. | 10 gives more signals. 5 is balanced. 2.5 is very selective. |
InpUpperPercentile |
95.0 | Upper tail percentile used for overbought rarity. | 90 gives more signals. 95 is balanced. 97.5 is very selective. |
InpSignalMode |
SIGNAL_EVERY_TAIL_BAR | Whether to mark every extreme bar or only the first entry into the tail. | Use entry-only for cleaner alerts. Use every-tail-bar for research and visual study. |
InpMaxBars |
5000 | Maximum bars displayed and researched. | Lower this on weak VPS machines. Use 0 only when you need full-history research. |
InpEnableAlerts |
false | Turns popup alerts on or off. | Keep off while testing many symbols. Enable after your rules are finalized. |
InpAlertOnClosedBar |
true | Chooses closed-bar alerts versus current-bar alerts. | Closed-bar is cleaner. Current-bar is faster but can flicker before candle close. |
Parameter Ideas By Trader Type
Scalper
Fast-moving M1-M5 traders who want earlier RSI tail warnings.
Suggested direction: RSI 7-10, lookback 100-150, tails 10/90, entry-only signals.
Day Trader
Balanced M15-H1 use where adaptive extremes matter but noise must be controlled.
Suggested direction: RSI 14, lookback 252, tails 5/95, closed-bar alerts.
Swing Trader
Slower H4-D1 research where fewer but cleaner RSI extremes are preferred.
Suggested direction: RSI 21-28, lookback 500-750, tails 2.5/97.5.
These are research starting points, not guaranteed profitable presets. Test each symbol and timeframe with realistic spread, commission, slippage, and session filters before using any RSI signal in live trading.
Where It Fits In The RSI Stack
This indicator is part of the AlgoSpecial RSI Research Cluster: six MT5 indicators designed to answer the questions a fixed RSI line cannot answer alone. The cluster covers percentile tails, volatility-conditioned thresholds, two-dimensional expectancy, oversold continuation risk, stressed-market rebound probability, and Hidden-Markov regime probabilities.
FAQ
Is this a buy and sell signal indicator?
It can plot arrows, but it is best treated as a research-grade RSI decision layer. Confirm entries with market structure, spread, session, volatility, and risk rules.
Does the free download include source code?
No. The free download is the compiled MT5 .ex5 file only. This keeps the proprietary research logic protected while still letting traders test the indicator.
Can I use it on XAUUSD, forex, crypto, or indices?
Yes, it is symbol based and can be attached to MT5 charts. The included chart image uses XAUUSD H1 because gold exposes RSI regime changes very clearly, but the logic is not limited to gold.





