Free MT5 RSI Research Indicator
RSI Regime Surface for MT5
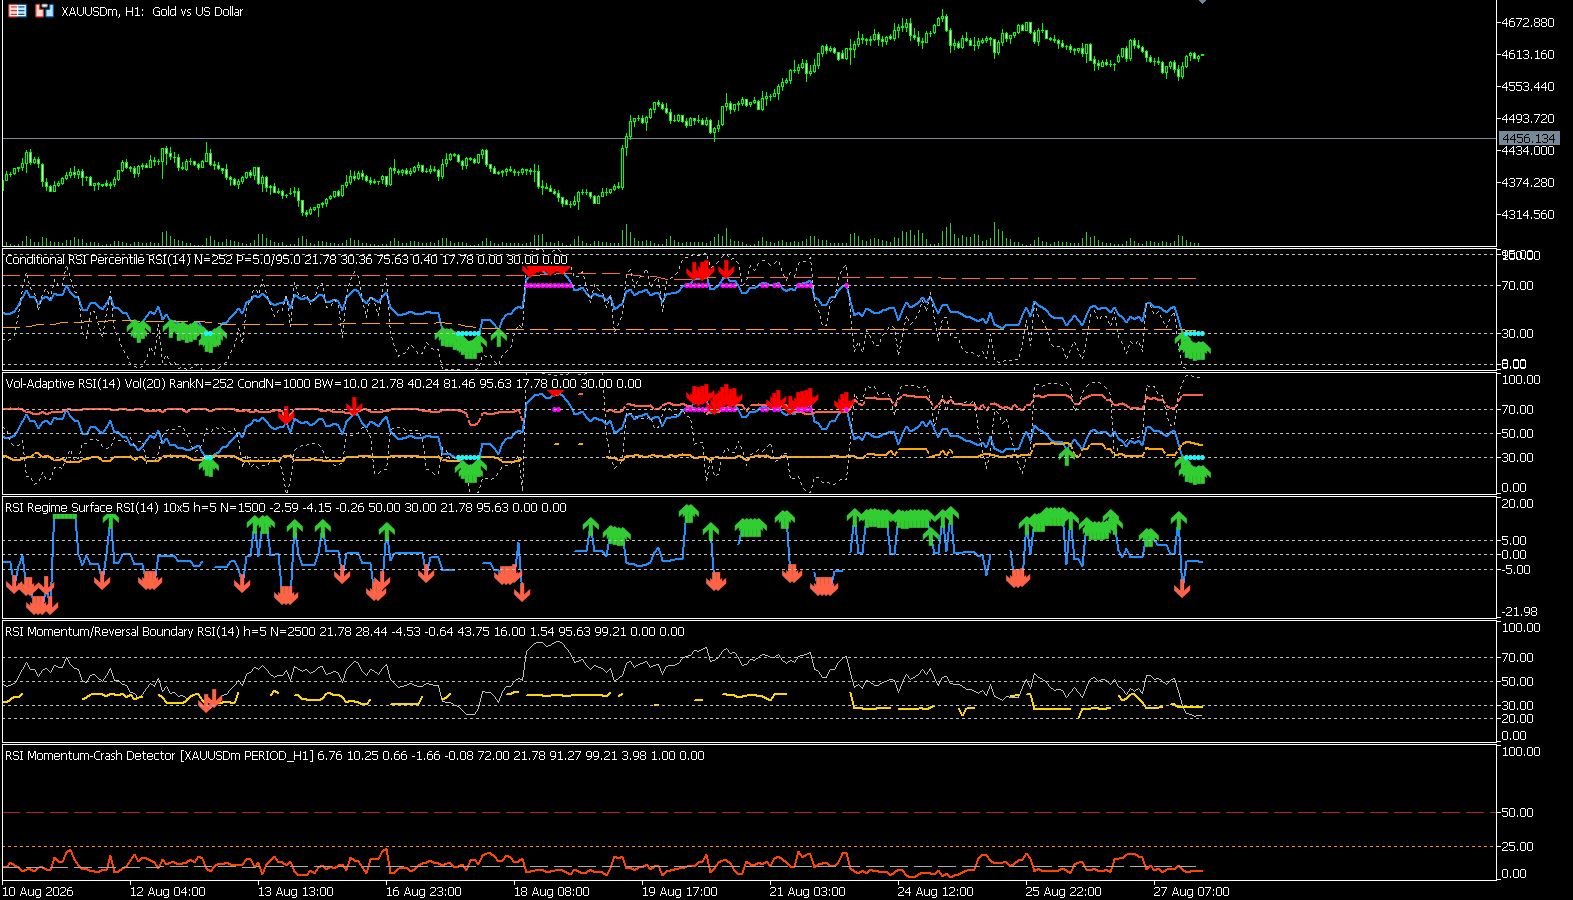
This turns RSI from a line into a two-dimensional expectancy map.
Compiled file only. Install in MQL5/Indicators. Source code is not included.
What It Solves
Quant-minded traders testing whether a specific RSI plus volatility state has positive or negative forward expectancy.
This is the evidence layer. Instead of saying "RSI below 30 is buy," it asks what happened after comparable RSI and volatility states on this symbol.
Technical Method
For each bar, the indicator trains on fully matured historical outcomes only. It maps the current RSI bin and volatility percentile bin to historical forward returns, then reports the shrinkage-adjusted expected return and diagnostics.
How This Indicator Works In Practice
RSI Regime Surface is the most explicitly research-oriented indicator in the cluster. It does not simply draw an oscillator level. It builds a two-dimensional table where one axis is RSI state and the other axis is volatility percentile state, then asks what forward returns followed comparable cells.
The output line is expected forward return in basis points. The Data Window diagnostics matter: sample count tells you if the cell has enough history, t-stat warns about noisy expectancy, and hit rate shows whether the average is supported by repeated outcomes or just a few large moves.
Input Parameters Explained
| Input | Default | Meaning | Tuning Guidance |
|---|---|---|---|
InpRSIPeriod |
14 | RSI period for state binning. | Keep 14 for comparability. Try 21 for slower swing systems. |
InpVolatilityPeriod |
20 | Rolling log-return volatility period. | Shorter for scalping, 20 for day trading, 50 for swing research. |
InpVolRankLookback |
252 | Prior bars used to convert volatility into a percentile. | 252 approximates a broad regime sample; 100-150 adapts faster. |
InpRSIBins |
10 | Number of RSI buckets across 0-100. | More bins are precise but need more history. Fewer bins are robust. |
InpVolatilityBins |
5 | Number of volatility percentile buckets. | 5 is balanced. 3 is safer on low-history symbols. |
InpForwardHorizon |
5 | Number of bars ahead used for outcome measurement. | 3-5 for scalping/intraday, 8-20 for swing research. |
InpTrainingLookback |
1500 | Matured historical feature observations used for each forecast. | Use at least 1000 where possible; 2000-3000 is better for stable symbols. |
InpMinCellSamples |
25 | Minimum observations required in the current RSI-volatility cell. | Lower gives more signals, higher gives more confidence. |
InpShrinkageSamples |
20.0 | Pulls noisy cell means toward a neutral prior. | Increase for conservative research. Set near 0 only when sample counts are high. |
InpReturnType |
SURFACE_LOG_RETURN_BPS | Uses log return or simple return for forward outcome. | Log returns are preferred for research. Simple returns are easier to explain. |
InpMinExpectedReturnBps |
5.0 | Minimum absolute expectancy required for a signal. | Raise to 8-15 for fewer, stronger signals. |
InpMinAbsTStat |
1.0 | Minimum absolute t-stat filter. | 0.75 is permissive, 1.0 balanced, 1.5+ conservative. |
InpSignalMode |
SURFACE_SIGNAL_EVERY_QUALIFYING_BAR | Signal every qualifying bar or only entry into qualification. | Entry-only is cleaner for alert workflows. |
InpMaxBars |
3000 | Maximum displayed/researched bars. | Reduce if chart refresh is slow. |
InpEnableAlerts |
false | Enables qualifying surface alerts. | Enable only after the cell diagnostics are understood. |
InpAlertOnClosedBar |
true | Closed-bar versus live-bar alerts. | Closed-bar avoids intrabar instability. |
Parameter Ideas By Trader Type
Quant Research
Best for studying whether an RSI state has repeatable expectancy.
Suggested direction: RSI bins 10, vol bins 5, training 1500-3000, min cell samples 25-50, t-stat 1.0+.
Signal Filter
Use as confirmation before taking another RSI or structure setup.
Suggested direction: Min expected return 8-12 bps, min t-stat 1.0-1.5, entry-only signals.
Low-History Symbol
When the broker has fewer reliable bars.
Suggested direction: RSI bins 5, volatility bins 3, min samples 15-20, stronger shrinkage.
These are research starting points, not guaranteed profitable presets. Test each symbol and timeframe with realistic spread, commission, slippage, and session filters before using any RSI signal in live trading.
Where It Fits In The RSI Stack
This indicator is part of the AlgoSpecial RSI Research Cluster: six MT5 indicators designed to answer the questions a fixed RSI line cannot answer alone. The cluster covers percentile tails, volatility-conditioned thresholds, two-dimensional expectancy, oversold continuation risk, stressed-market rebound probability, and Hidden-Markov regime probabilities.
FAQ
Is this a buy and sell signal indicator?
It can plot arrows, but it is best treated as a research-grade RSI decision layer. Confirm entries with market structure, spread, session, volatility, and risk rules.
Does the free download include source code?
No. The free download is the compiled MT5 .ex5 file only. This keeps the proprietary research logic protected while still letting traders test the indicator.
Can I use it on XAUUSD, forex, crypto, or indices?
Yes, it is symbol based and can be attached to MT5 charts. The included chart image uses XAUUSD H1 because gold exposes RSI regime changes very clearly, but the logic is not limited to gold.





