Gold Calendar 2026: The Forex Economic Calendar That Actually Moves XAUUSD
Most forex calendars list every release. Gold does not trade every release. This gold calendar filters the 2026 forex economic calendar down to the events that move XAUUSD, then measures what gold actually did in the 60 minutes after 181 high-impact USD releases.
Why a Gold Calendar Is Not the Same as a Forex Calendar
A standard forex calendar shows every economic release for every currency. A forex economic calendar adds forecasts, previous values and impact ratings. A gold calendar goes one step further: it ranks releases by their actual effect on XAUUSD.
Gold has no central bank and no earnings. It reacts through four channels: the expected path of US interest rates, real yields, the US dollar, and risk appetite. That is why a hot CPI print can be bearish for gold in the first hour even though inflation is supposedly gold-positive: the market reads it as “the Fed must stay tight,” real yields rise, and gold reprices lower.
2026 High-Impact Event Heatmap
Monthly count of high-impact events by currency. The 2026 calendar contains 828 high-impact events; 494 are USD, followed by EUR 141, GBP 69 and JPY 60. September is the busiest month with 81 high-impact events.
| Month | USD | EUR | GBP | JPY | CNY | CAD | CHF | AUD | NZD | Other | Total |
|---|---|---|---|---|---|---|---|---|---|---|---|
| Jan | 42 | 9 | 5 | 5 | 2 | 1 | 0 | 0 | 0 | 0 | 64 |
| Feb | 38 | 16 | 8 | 4 | 0 | 1 | 0 | 1 | 2 | 0 | 70 |
| Mar | 44 | 13 | 7 | 6 | 2 | 1 | 4 | 1 | 0 | 0 | 78 |
| Apr | 48 | 13 | 6 | 5 | 2 | 1 | 0 | 0 | 1 | 0 | 76 |
| May | 41 | 9 | 7 | 4 | 1 | 0 | 0 | 1 | 4 | 0 | 67 |
| Jun | 43 | 15 | 5 | 6 | 1 | 1 | 2 | 1 | 0 | 0 | 74 |
| Jul | 42 | 14 | 7 | 5 | 2 | 1 | 0 | 0 | 1 | 0 | 72 |
| Aug | 39 | 5 | 3 | 4 | 1 | 0 | 0 | 1 | 1 | 0 | 54 |
| Sep | 44 | 18 | 7 | 5 | 1 | 1 | 3 | 1 | 1 | 0 | 81 |
| Oct | 40 | 15 | 7 | 6 | 2 | 3 | 0 | 0 | 1 | 0 | 74 |
| Nov | 37 | 8 | 4 | 4 | 1 | 1 | 0 | 1 | 2 | 0 | 58 |
| Dec | 36 | 6 | 3 | 6 | 1 | 2 | 3 | 1 | 1 | 1 | 60 |
Source: 2026 economic calendar export; high-impact rows only. “Other” includes currencies outside the nine major columns.
Which 2026 Events Moved Gold the Most?
We matched every high-impact USD event to XAUUSD M15 bars and measured the range from the event timestamp to 60 minutes later. Range is the highest high minus the lowest low inside that window. The sample covers 181 events through 30 October 2026.
| Event | Sample | Median 60m range | Median absolute move | Volume vs pre-60m | First 15m range | Next 45m range | Reversal rate |
|---|---|---|---|---|---|---|---|
| NFP | 9 | $65.13 | $21.34 | 3.06x | $47.51 | $32.96 | 66.67% |
| FOMC | 14 | $63.73 | $39.80 | 2.05x | $33.11 | $47.13 | 35.71% |
| CPI | 10 | $40.69 | $15.18 | 1.89x | $34.17 | $27.46 | 50.00% |
| ADP | 10 | $30.95 | $10.09 | 1.28x | $16.02 | $24.85 | 50.00% |
| Retail Sales | 11 | $30.18 | $11.07 | 1.43x | $21.04 | $23.38 | 54.55% |
| PCE | 11 | $28.39 | $12.87 | 2.00x | $13.78 | $21.59 | 18.18% |
| ISM Manufacturing | 10 | $28.24 | $7.70 | 0.79x | $18.83 | $25.40 | 60.00% |
| ISM Services | 9 | $27.01 | $11.13 | 0.96x | $14.79 | $20.90 | 55.56% |
| EIA Crude | 43 | $24.60 | $10.41 | 0.70x | $11.84 | $20.48 | 41.86% |
| GDP | 11 | $23.32 | $5.06 | 2.00x | $15.33 | $20.93 | 27.27% |
| Jobless Claims | 43 | $23.32 | $6.61 | 1.43x | $15.33 | $21.65 | 65.12% |
| All measured | 181 | $30.18 | $11.13 | 1.27x | $17.04 | $23.17 | 49.17% |
2026 NFP, CPI and FOMC Dates
These are the major XAUUSD dates for planning. Times are shown as recorded in the source platform; always convert to your broker server time and verify against the official schedule.
| Date | Time | Type | Event |
|---|---|---|---|
| Jan 9, 2026 | 13:30 | NFP | Nonfarm Payrolls |
| Jan 13, 2026 | 13:30 | CPI | CPI m/m |
| Jan 28, 2026 | 19:00 | FOMC | Fed Interest Rate Decision |
| Jan 28, 2026 | 19:30 | FOMC | FOMC Press Conference |
| Feb 11, 2026 | 13:30 | NFP | Nonfarm Payrolls |
| Feb 13, 2026 | 13:30 | CPI | CPI m/m |
| Mar 6, 2026 | 13:30 | NFP | Nonfarm Payrolls |
| Mar 11, 2026 | 12:30 | CPI | CPI m/m |
| Mar 18, 2026 | 18:00 | FOMC | Fed Interest Rate Decision |
| Mar 18, 2026 | 18:30 | FOMC | FOMC Press Conference |
| Apr 3, 2026 | 12:30 | NFP | Nonfarm Payrolls |
| Apr 10, 2026 | 12:30 | CPI | CPI m/m |
| Apr 29, 2026 | 18:00 | FOMC | Fed Interest Rate Decision |
| Apr 29, 2026 | 18:30 | FOMC | FOMC Press Conference |
| May 8, 2026 | 12:30 | NFP | Nonfarm Payrolls |
| May 12, 2026 | 12:30 | CPI | CPI m/m |
| Jun 5, 2026 | 12:30 | NFP | Nonfarm Payrolls |
| Jun 10, 2026 | 12:30 | CPI | CPI m/m |
| Jun 17, 2026 | 18:00 | FOMC | Fed Interest Rate Decision |
| Jun 17, 2026 | 18:30 | FOMC | FOMC Press Conference |
| Jul 2, 2026 | 12:30 | NFP | Nonfarm Payrolls |
| Jul 14, 2026 | 12:30 | CPI | CPI m/m |
| Jul 29, 2026 | 18:00 | FOMC | Fed Interest Rate Decision |
| Jul 29, 2026 | 18:30 | FOMC | FOMC Press Conference |
| Aug 7, 2026 | 12:30 | NFP | Nonfarm Payrolls |
| Aug 12, 2026 | 12:30 | CPI | CPI m/m |
| Sep 4, 2026 | 12:30 | NFP | Nonfarm Payrolls |
| Sep 11, 2026 | 12:30 | CPI | CPI m/m |
| Sep 16, 2026 | 18:00 | FOMC | Fed Interest Rate Decision |
| Sep 16, 2026 | 18:30 | FOMC | FOMC Press Conference |
| Oct 2, 2026 | 12:30 | NFP | Nonfarm Payrolls |
| Oct 14, 2026 | 12:30 | CPI | CPI m/m |
| Oct 28, 2026 | 18:00 | FOMC | Fed Interest Rate Decision |
| Oct 28, 2026 | 18:30 | FOMC | FOMC Press Conference |
| Nov 6, 2026 | 13:30 | NFP | Nonfarm Payrolls |
| Nov 10, 2026 | 13:30 | CPI | CPI m/m |
| Dec 4, 2026 | 13:30 | NFP | Nonfarm Payrolls |
| Dec 9, 2026 | 19:00 | FOMC | Fed Interest Rate Decision |
| Dec 9, 2026 | 19:30 | FOMC | FOMC Press Conference |
| Dec 10, 2026 | 13:30 | CPI | CPI m/m |
How to Trade Gold Around News Without Chasing the Spike
The data supports a simple process: decide exposure before the release, assume the spread widens, and let the first candle close before acting. Gold spreads can triple during CPI or NFP, and stops placed inside the widening are often taken at prices the chart never shows.
- Before the release: reduce size or stand aside. FOMC has two events 30 minutes apart, so treat the statement and press conference as one combined risk window.
- First 15 minutes: use it to measure the initial reaction, not to chase. NFP reversed in two-thirds of our measured events.
- Next 45 minutes: FOMC and PCE expanded in the second phase. Wait for liquidity to return before entering continuation.
- Spread and slippage: use wider stops or no position. A tight stop during a news spike is not risk management; it is a donation.
- Log the reaction: record actual vs forecast, first 15m direction, next 45m direction and range. That is how a calendar becomes an edge.
Download the Gold Calendar 2026 Research Files
These are aggregated research outputs, not the raw calendar rows. Use them for planning, dashboards and event-risk studies.
Downloads are email-gated to prevent abuse. The raw MQL5 calendar export is not published.
Methodology and Data Quality
The calendar export contains 13,583 rows for 2026: 828 high-impact, 4,314 moderate, 8,192 low and 249 none. It covers 19 currencies, 23 countries and 1,216 unique event names. The reaction study uses XAUUSD M15 data from 2017 through 30 October 2026 and measures 181 high-impact USD events with enough bars on both sides of the release.
Event windows are measured from the recorded event timestamp to 60 minutes later. Pre-event volume is the 60 minutes before the timestamp. Reversal rate compares the sign of the first 15-minute move with the sign of the next 45-minute move. The study is descriptive, not predictive. Spreads, slippage and broker execution are not modelled.
For official schedules, verify with the Federal Reserve, BLS, BEA and ECB. This page is educational research, not financial advice.
Gold Calendar 2026 FAQ
What is the Gold Calendar 2026?
It is a 2026 forex economic calendar filtered for events that move XAUUSD: NFP, CPI, PCE, FOMC decisions, Fed press conferences, GDP, retail sales, ISM and other high-impact USD releases.
Which event moves gold the most?
In our 2026 XAUUSD M15 study, NFP had a median 60-minute range of $65.13, FOMC $63.73 and CPI $40.69 per ounce. The 181-event median was $30.18.
What time are US economic releases in 2026?
Most US data is released at 13:30 platform/server time, with some periods at 12:30. FOMC decisions are usually at 18:00 or 19:00, followed by the press conference 30 minutes later. Always convert to your broker server time.
Does gold always fall on strong US data?
No. Strong data can lift real yields and the dollar, which is usually bearish for gold, but the reaction depends on positioning, inflation expectations and risk appetite. Our study measures the range, not a guaranteed direction.
Should I trade the first 15 minutes after NFP?
Our 2026 data shows NFP had a 66.67% reversal rate between the first 15-minute move and the next 45 minutes. Waiting for the first candle to close can reduce chasing the initial spike.
Is this a live economic calendar?
This page is a 2026 planning and research page. For live values, use the AlgoSpecial live economic calendar and verify the exact release time with the official source.
Can I download the Gold Calendar 2026 data?
You can download the aggregated reaction study and high-impact heatmap CSV files. We do not republish the raw MQL5 calendar rows.
Is the Gold Calendar 2026 financial advice?
No. It is educational research. Economic releases can cause spread widening, slippage and rapid losses. Test any news strategy on demo first.
Related Gold and Forex Calendar Resources
Choose the next useful step
Most visitors arrive with one question: build, test, price, or trust. These shortcuts keep the path practical.
Go deeper before you build, download or automate
Hand-picked engineering articles, indicator breakdowns and trading-system tools so visitors keep exploring instead of leaving after one page.
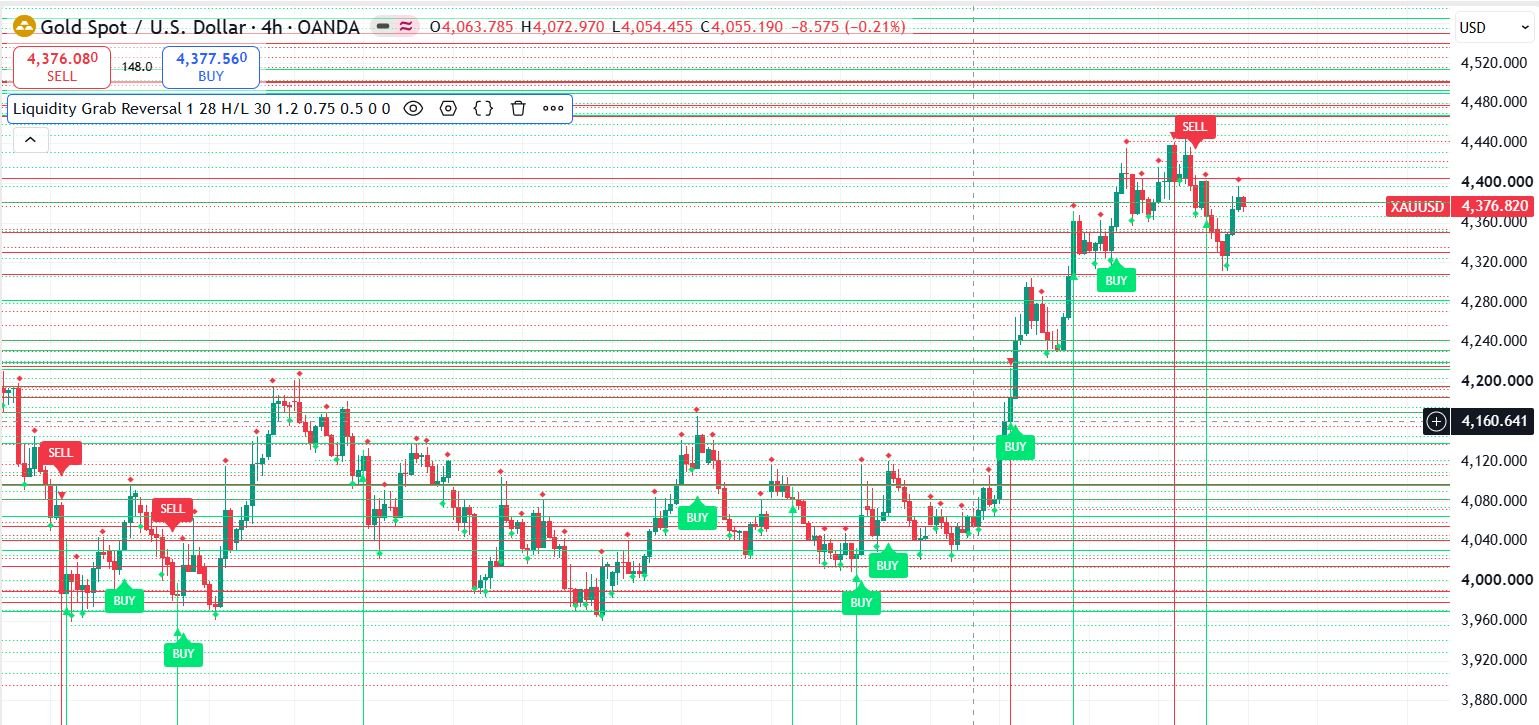
Pine Script to MT4/MT5 Conversion Planner
Analyze Pine strategies, repainting risk, TradingView alert bridges, MTF synchronization and the correct MQL4/MQL5 build path before paying for conversion.
Open planner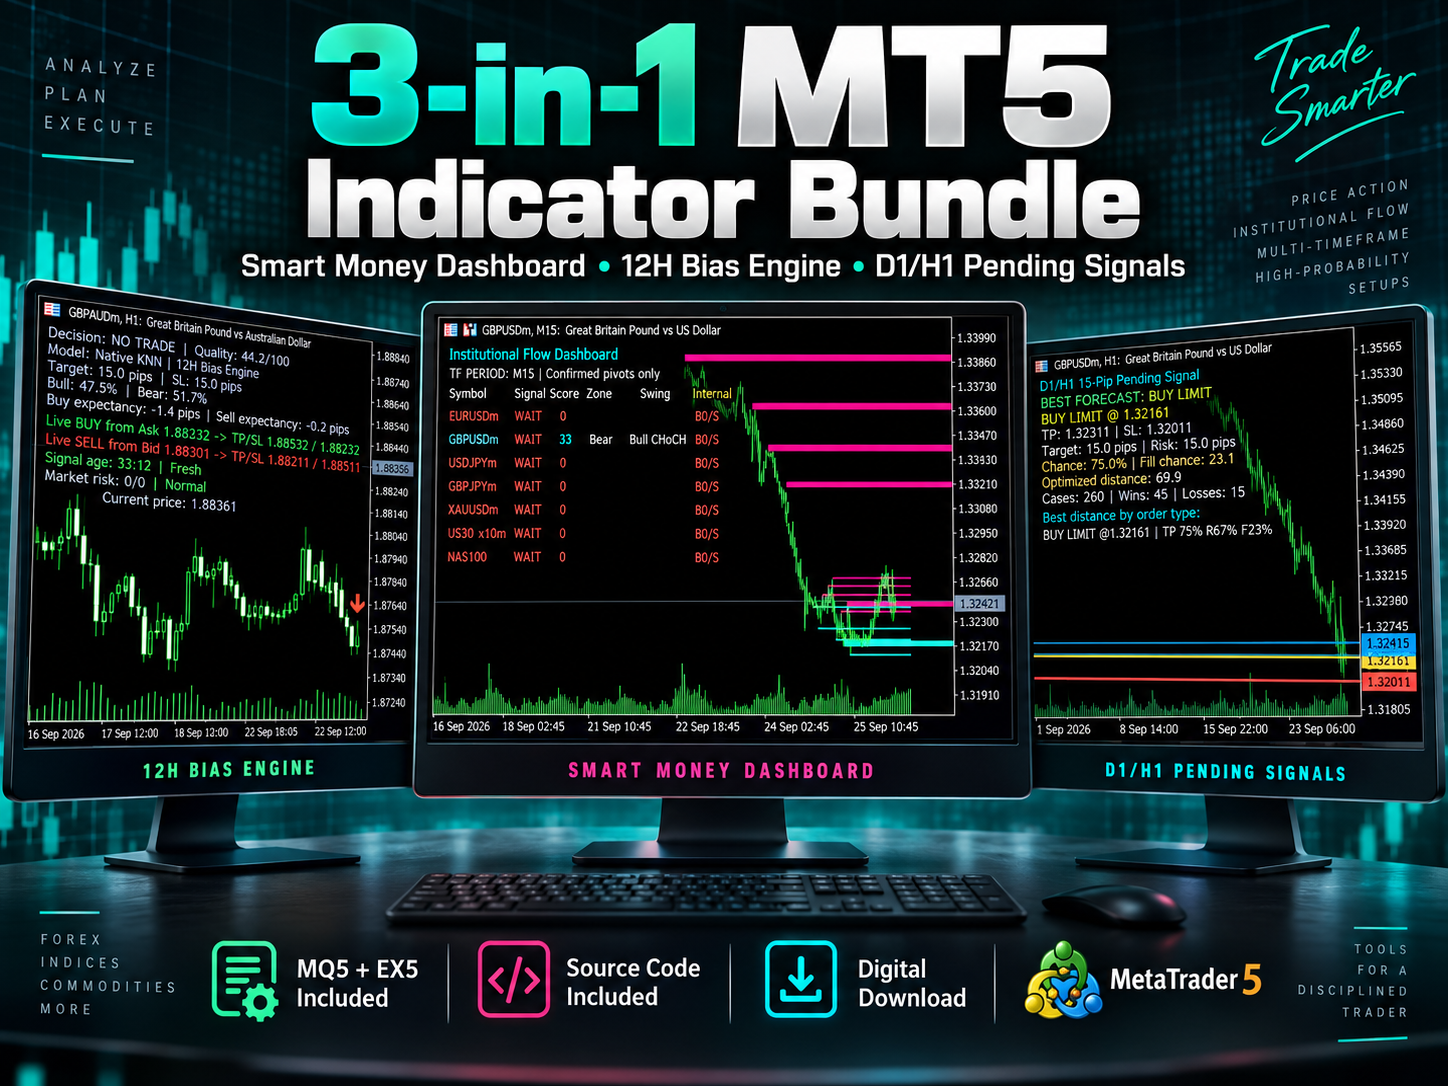
3-in-1 MT5 Indicator Bundle
12H Bias Engine, Smart Money Institutional Flow Dashboard and D1/H1 pending-signal logic with MQ5 + EX5 source included via Etsy.
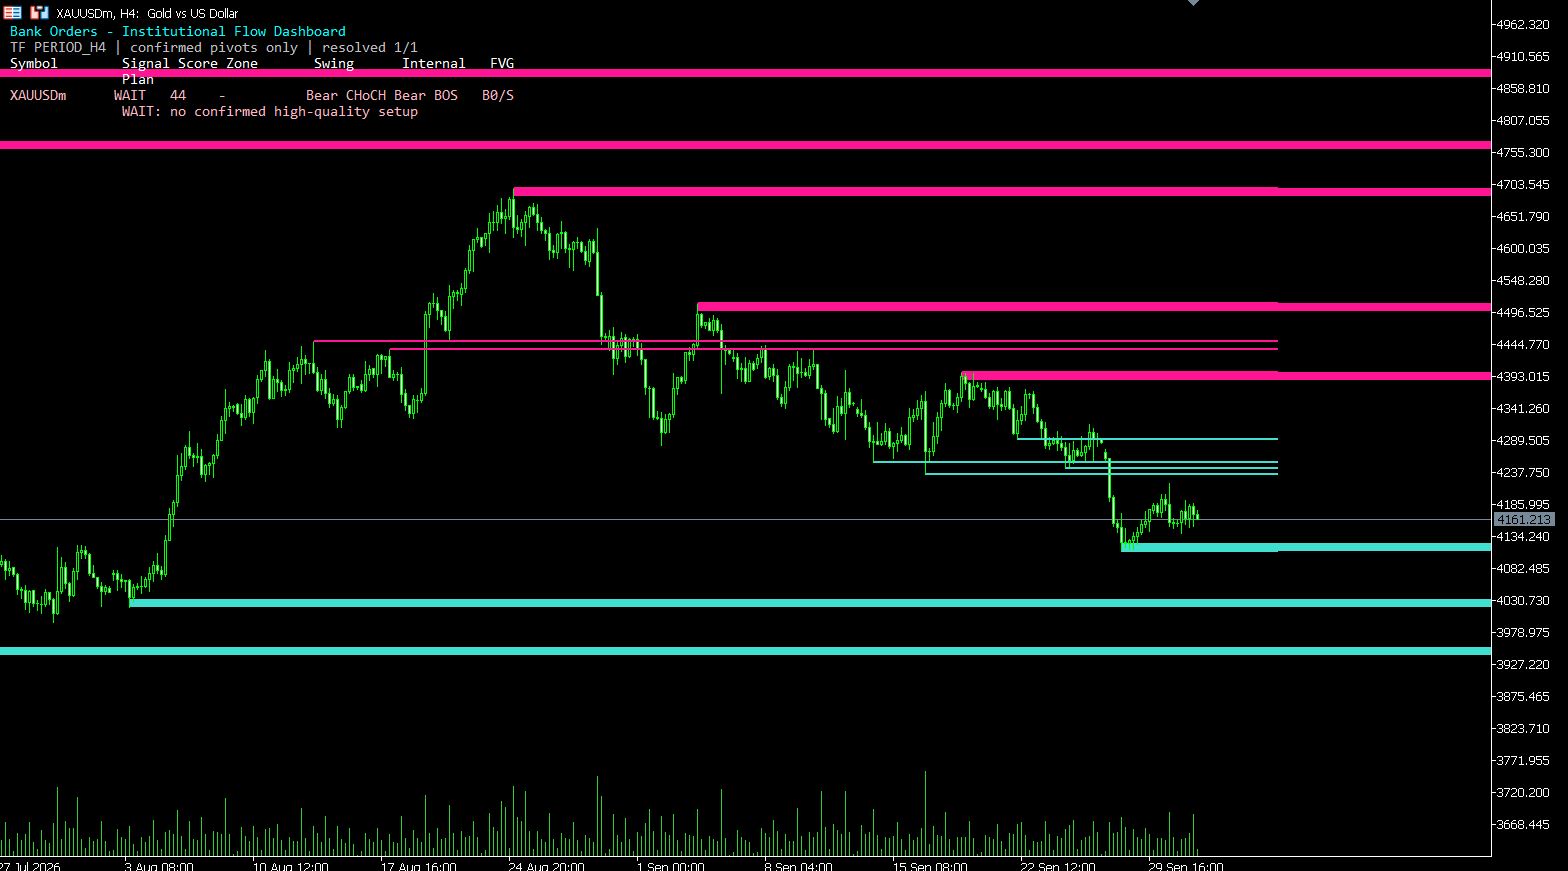
MT5 Bank Orders Institutional Flow Dashboard
Supply/demand zones, BOS/CHoCH, liquidity levels, FVG, equal highs/lows and confirmed trade-plan logic explained with EX5 download.
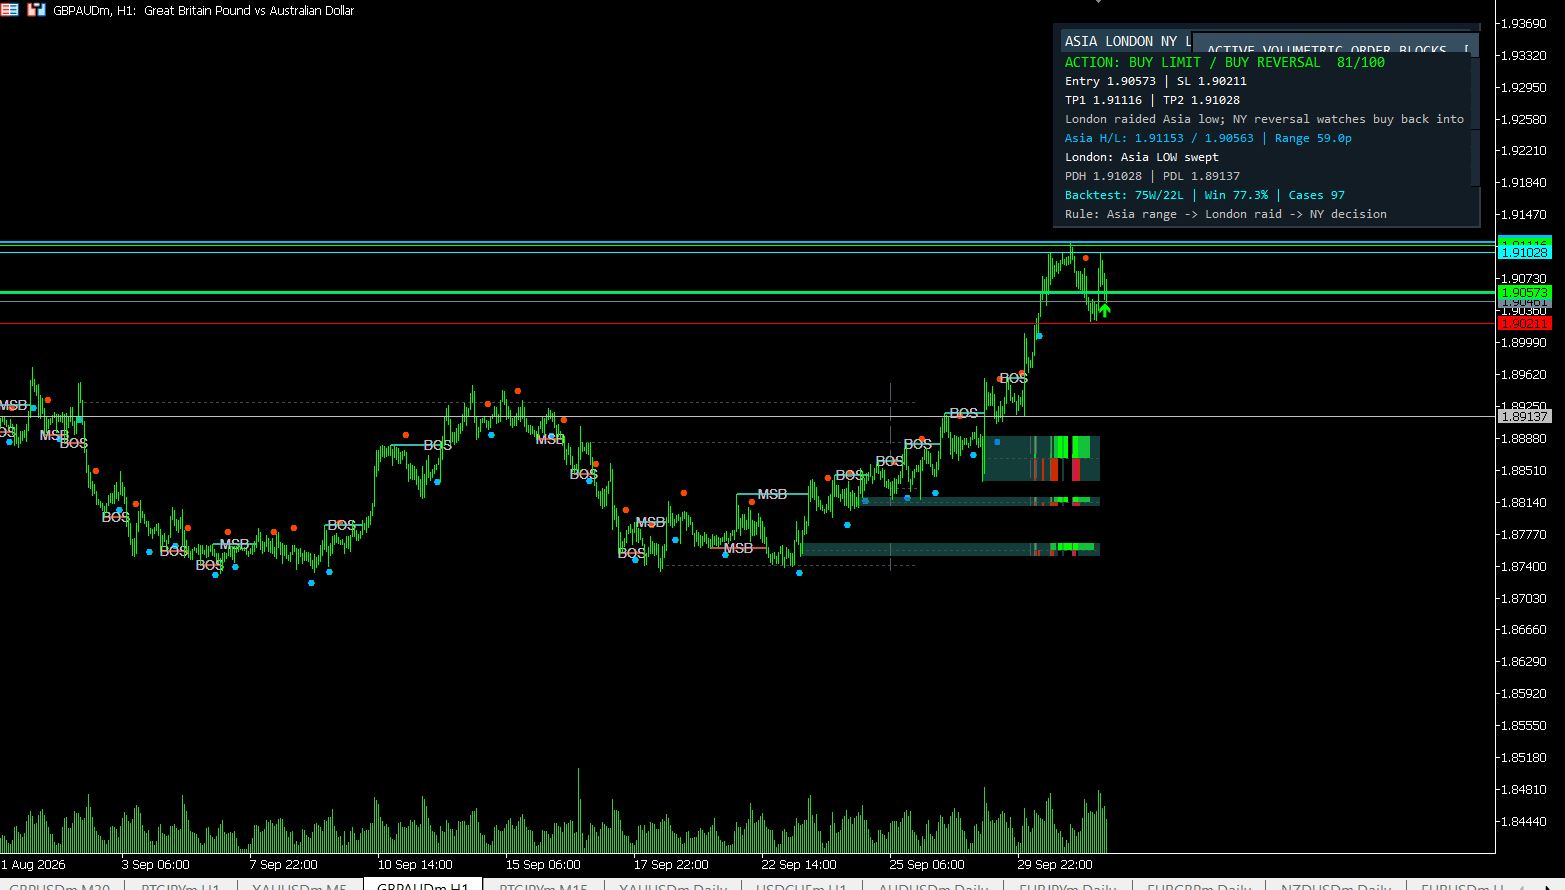
MT5 Asia London NY Liquidity Engine
Asia range, London raid and New York continuation/reversal planning with internal session backtest stats and entry/SL/TP dashboard.
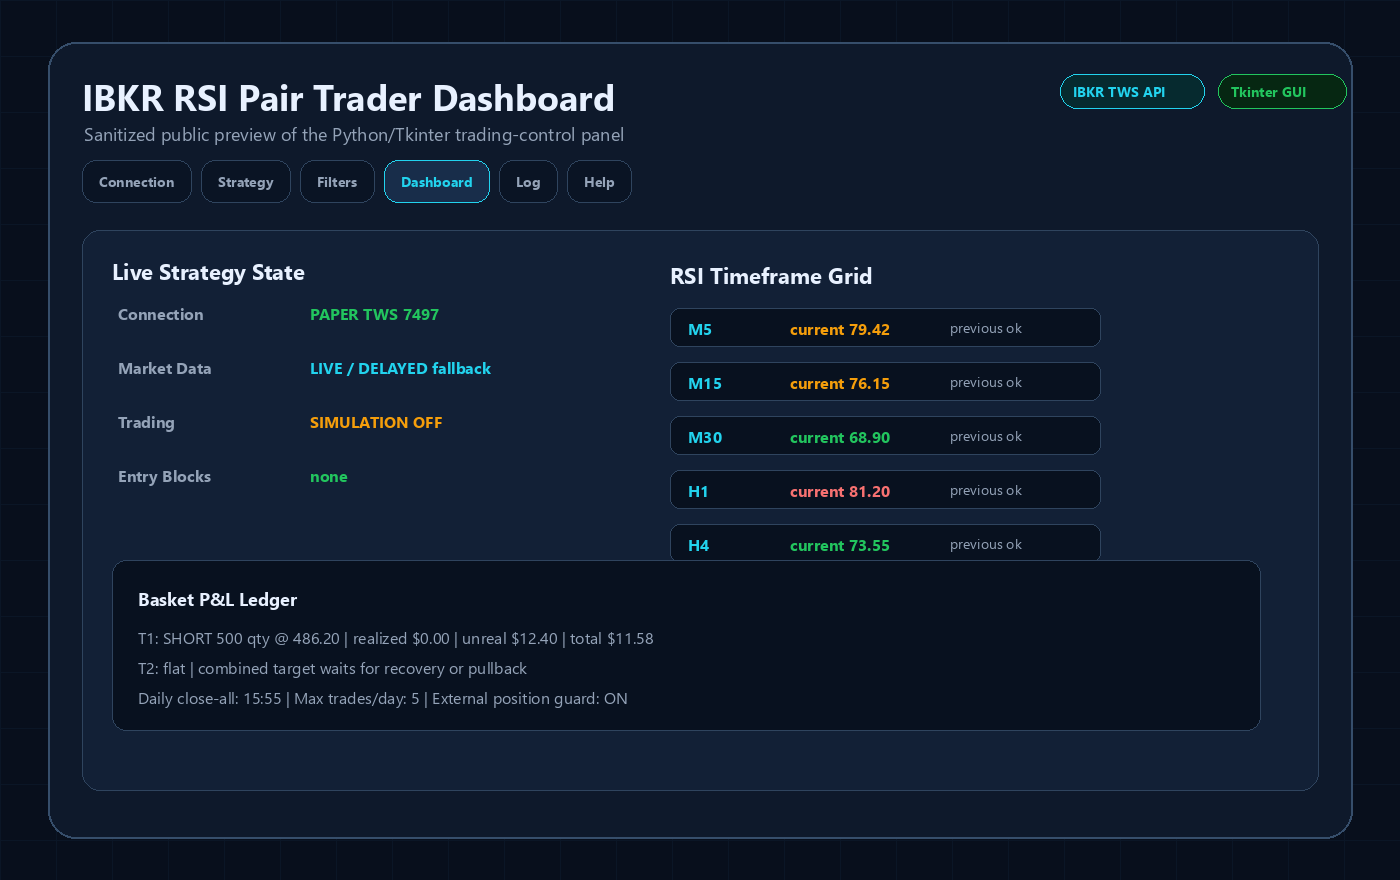
Interactive Brokers RSI Pair Trader
Tkinter desktop trading workflow, TWS API connection handling, RSI pair logic, risk controls and custom IBKR development positioning.
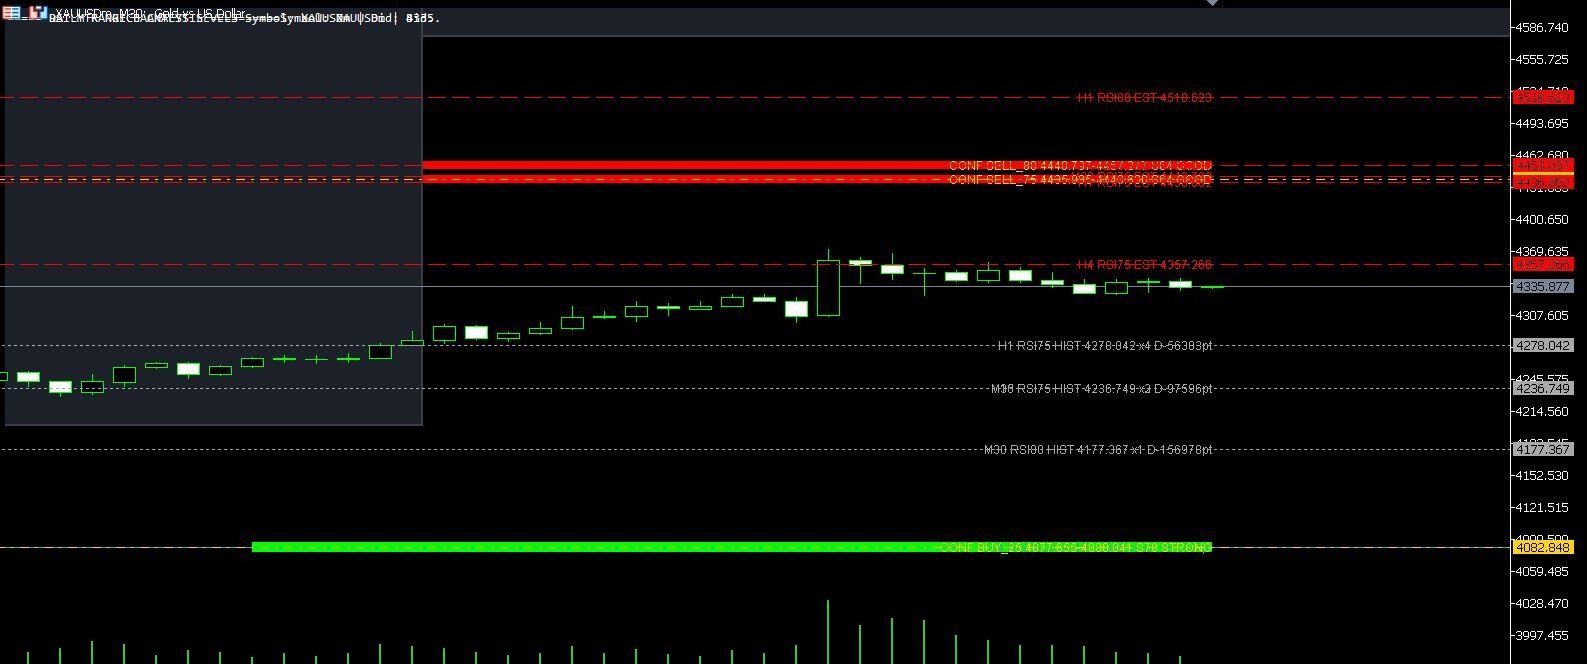
XAUUSD M30 CSV Data For Backtesting
Use clean MT5 historical data for Python backtests, strategy validation, spread checks and realistic gold EA research workflows.