Indicator-Labeled Historical Datasets — RSI, EMA, ATR, Bollinger, MACD & ADX
Skip the feature-engineering step. These datasets add technical indicators, session labels, volatility regimes and causal break flags to clean OHLC data. Ready for pandas, Polars, DuckDB, scikit-learn and MT5 research.
Available Indicator-Labeled Datasets
Each file contains the original OHLCV columns plus precomputed indicators. Downloads are email-gated to prevent abuse.
| Dataset | Timeframe | Rows | Coverage | CSV | Parquet |
|---|---|---|---|---|---|
| XAUUSD | M15 | 225,077 | 2017.01.19 → 2026.10.30 | CSV | Parquet |
| XAUUSD | H1 | 57,080 | 2017.01.19 → 2026.10.30 | CSV | Parquet |
| BTCUSDT | M15 | 13,358 | 2026.06.01 → 2026.10.19 | CSV | Parquet |
| EURUSD | M15 | 27,099 | 2024.11.21 → 2025.12.24 | CSV | Parquet |
| GBPUSD | M15 | 10,941 | 2025.07.17 → 2025.12.24 | CSV | Parquet |
| USDJPY | H1 | 7,718 | 2024.09.27 → 2025.12.24 | CSV | Parquet |
What’s Inside
Oscillators
RSI(14), Stochastic %K/%D(3,2,1), MACD(6,13,4), ADX(14), +DI and -DI.
Trend & volatility
EMA 9/13/34/50/200, ATR(14), Bollinger Bands(20,2), Bollinger width and volatility regime.
Market context
Session label, server-time hour, day of week, VWAP, body, range, wicks, 10-bar break flags and descriptive pivot flags.
pivot_high_10 and pivot_low_10 use future bars and are descriptive only. They are excluded from the ML-ready datasets. Use high_10_break and low_10_break as causal features.How the Indicators Are Calculated
RSI, ATR and ADX use Wilder smoothing. EMAs use exponential moving averages with the stated span. Bollinger Bands use a 20-bar simple moving average and two standard deviations. MACD uses EMA(6), EMA(13) and a 4-bar signal EMA. Stochastic uses a 3-bar range and 2-bar %D smoothing. VWAP is session-anchored when volume is available; otherwise it falls back to a 20-bar typical-price mean.
All calculations are causal except the two descriptive pivot columns. Warm-up rows contain empty indicator values; drop them before training.
Indicator Dataset FAQ
What is an indicator-labeled dataset?
It is an OHLC dataset with precomputed technical indicators and market-context columns such as RSI, EMA, ATR, Bollinger Bands, MACD, Stochastic, ADX, VWAP, session and volatility regime.
Can I use these datasets for machine learning?
Yes. The numeric indicator columns can be used as features. For labels and train/validation/test splits, use the ML-ready datasets.
Are pivot high and pivot low columns safe for prediction?
No. Pivot high and pivot low columns are descriptive and use future bars. They are excluded from the ML-ready datasets to prevent lookahead leakage.
What timezone are the timestamps in?
Timestamps are broker server time. Convert to UTC or New York time before building session-based features.
Build a Custom Date Range
Need a different symbol, timeframe or date range? Use the Custom Historical Data Builder to download CSV, JSON or Parquet.
Choose the next useful step
Most visitors arrive with one question: build, test, price, or trust. These shortcuts keep the path practical.
Go deeper before you build, download or automate
Hand-picked engineering articles, indicator breakdowns and trading-system tools so visitors keep exploring instead of leaving after one page.
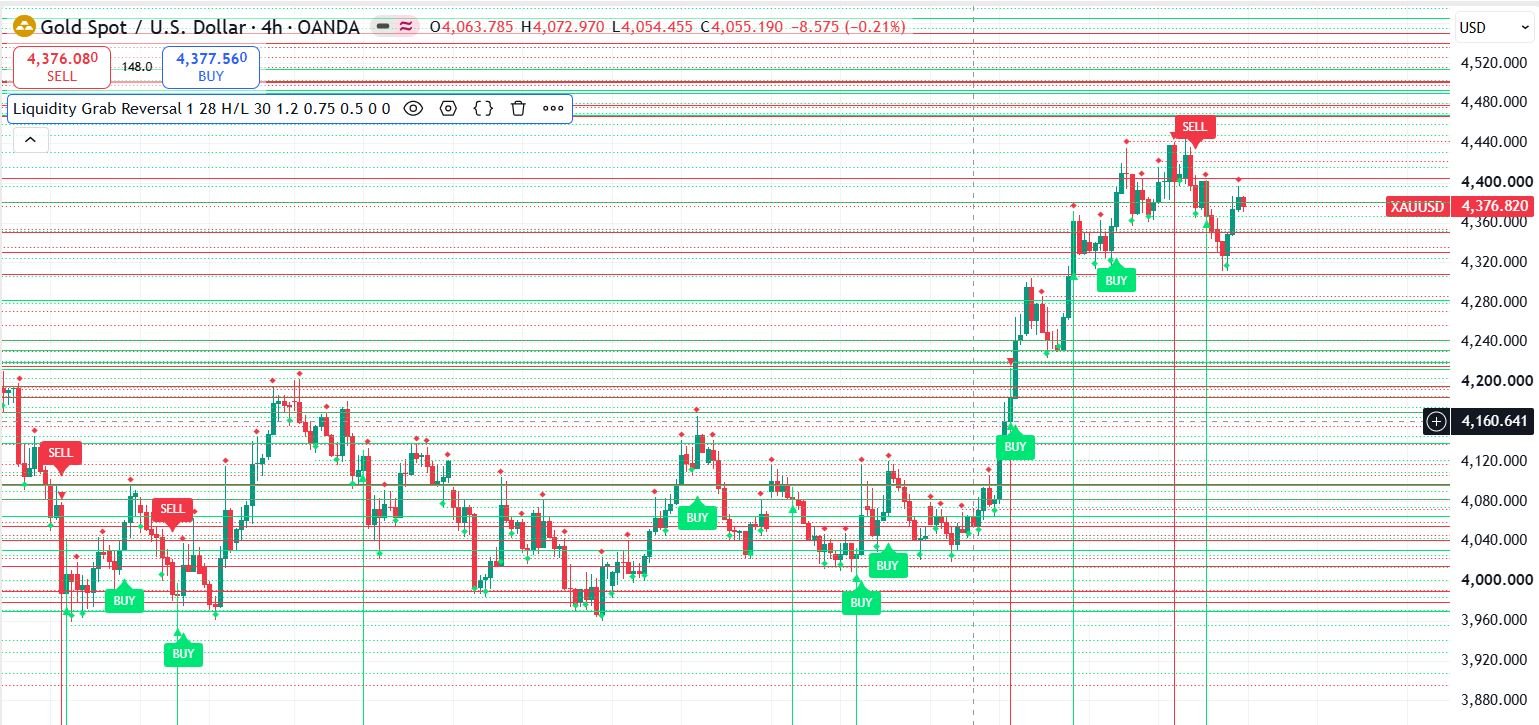
Pine Script to MT4/MT5 Conversion Planner
Analyze Pine strategies, repainting risk, TradingView alert bridges, MTF synchronization and the correct MQL4/MQL5 build path before paying for conversion.
Open planner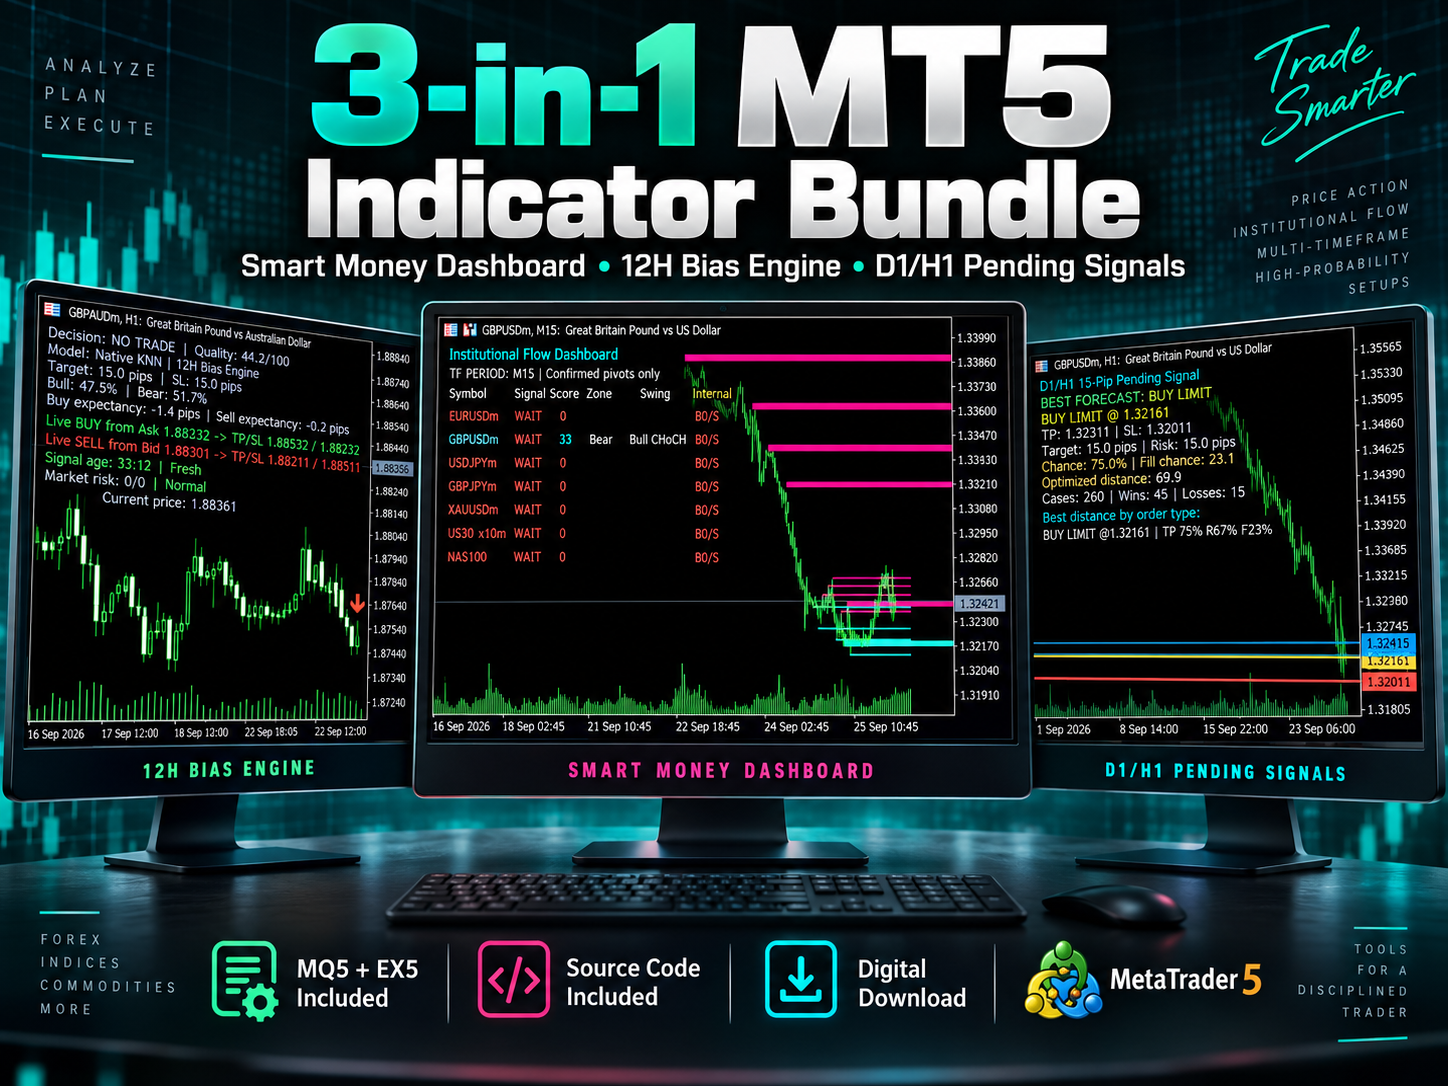
3-in-1 MT5 Indicator Bundle
12H Bias Engine, Smart Money Institutional Flow Dashboard and D1/H1 pending-signal logic with MQ5 + EX5 source included via Etsy.
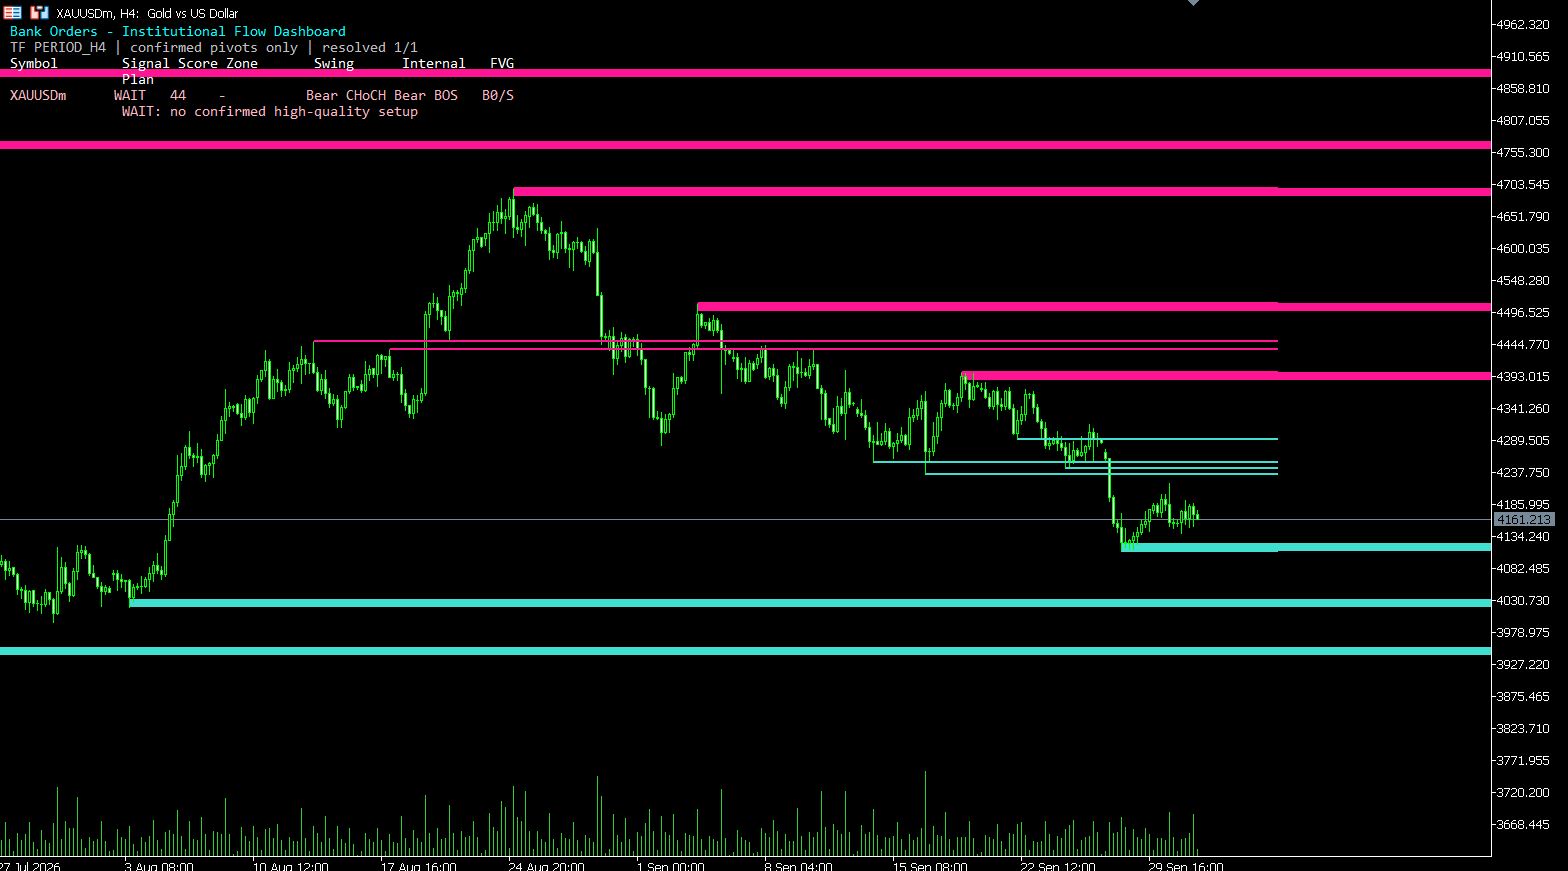
MT5 Bank Orders Institutional Flow Dashboard
Supply/demand zones, BOS/CHoCH, liquidity levels, FVG, equal highs/lows and confirmed trade-plan logic explained with EX5 download.
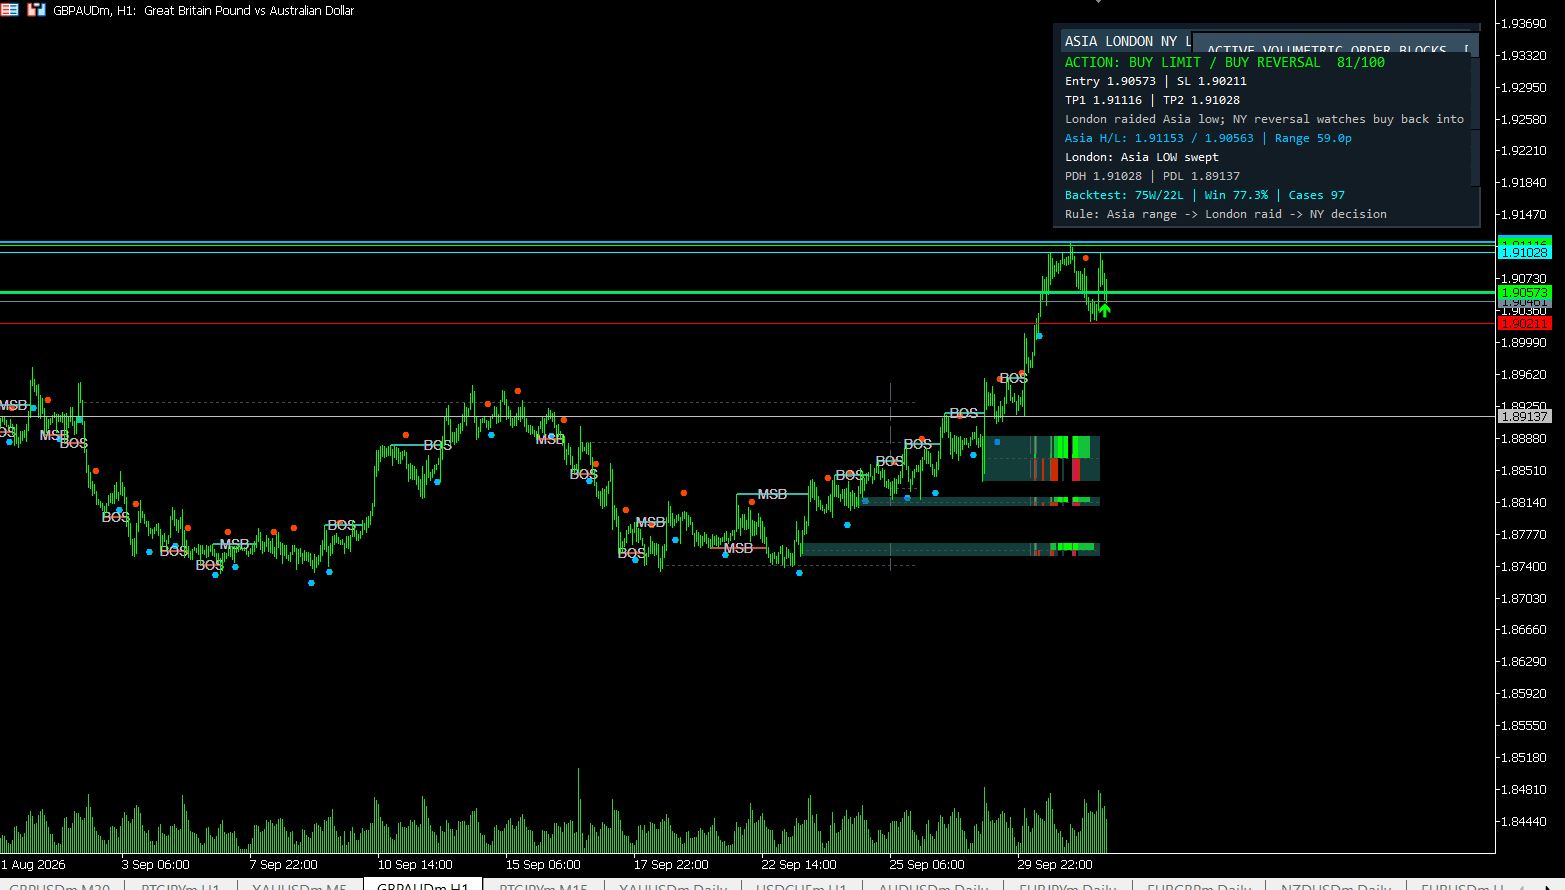
MT5 Asia London NY Liquidity Engine
Asia range, London raid and New York continuation/reversal planning with internal session backtest stats and entry/SL/TP dashboard.
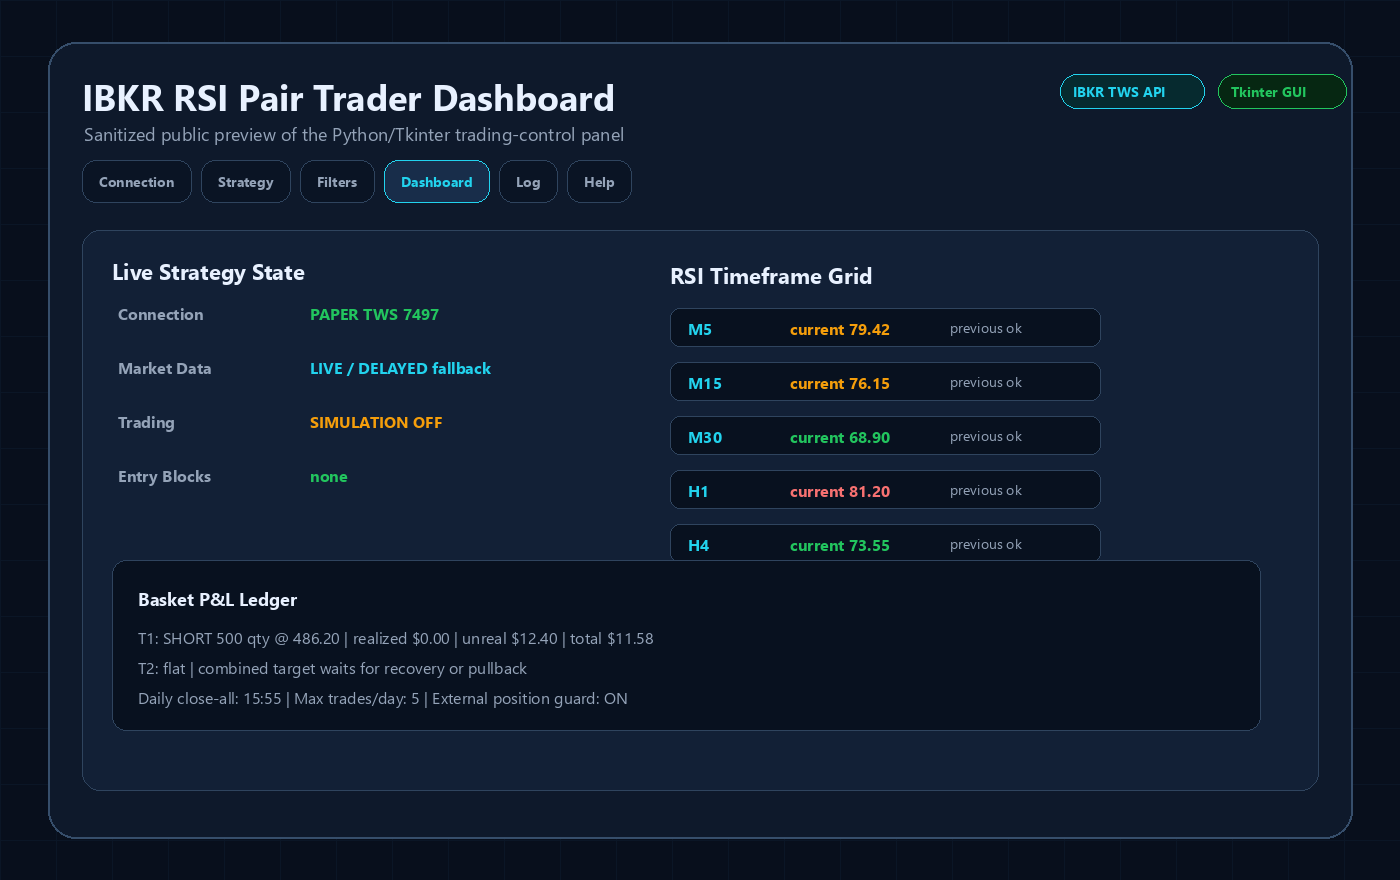
Interactive Brokers RSI Pair Trader
Tkinter desktop trading workflow, TWS API connection handling, RSI pair logic, risk controls and custom IBKR development positioning.
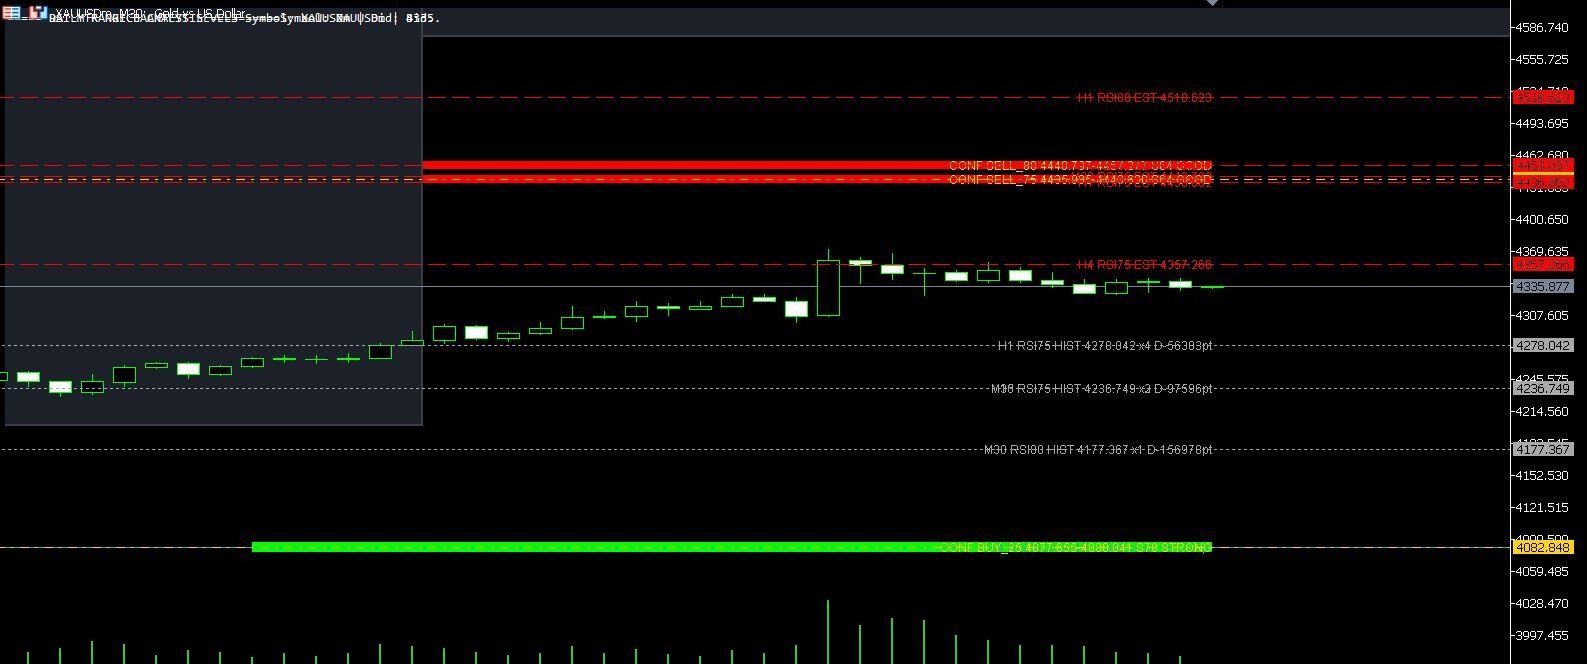
XAUUSD M30 CSV Data For Backtesting
Use clean MT5 historical data for Python backtests, strategy validation, spread checks and realistic gold EA research workflows.