Session Heatmap — Hourly Volatility by Symbol
See when each market actually moves. The heatmap aggregates real H1 bars by weekday and hour, normalises the average range into an index, and ranks the hottest hours. Use it to align session filters, EA trading windows and scalping hours.
Values are price range in points. The index is 100 = the symbol's average hour. Shift the hours to view the grid in another time zone.
Sessions (GMT): Asia 00:00–09:00 · London 07:00–16:00 · New York 12:00–21:00. Weekend cells are mostly empty for forex/metals/indices; crypto is 24/7.
How the index is calculated
For every H1 bar the range is high − low, converted to points using the symbol's decimals. Bars are grouped by weekday and hour; each cell stores the count, mean, median and 90th percentile. The index divides the cell mean by the symbol's overall mean hour and multiplies by 100. Cells with fewer than one bar are left empty; thin cells should be read with caution.
Why weekday × hour?
Volatility is not uniform: gold and indices concentrate movement in the London/New York overlap, crypto trades around the clock but still has hour-of-day patterns, and Monday opens behave differently from Thursday afternoons. This grid exposes those patterns from your actual data.
FAQ
Is the heatmap live?
No. It is computed from the exported historical dataset for that symbol (same data as the ZIP). Rebuilds happen when the datasets are updated.
Why do values differ from my broker?
Ranges come from this broker's feed. Spread, session hours and volatility differ between brokers; use the shape of the heatmap, not the absolute points, when comparing.
What time zone is shown?
The grid starts in broker server time; use the hour shift to convert to GMT or IST. Session labels in the note are GMT.
Related tools
Turn the calculation into an EA
If the tool exposed a profitable or risky condition, convert it into a coded rule with testing and guardrails.
Go deeper before you build, download or automate
Hand-picked engineering articles, indicator breakdowns and trading-system tools so visitors keep exploring instead of leaving after one page.
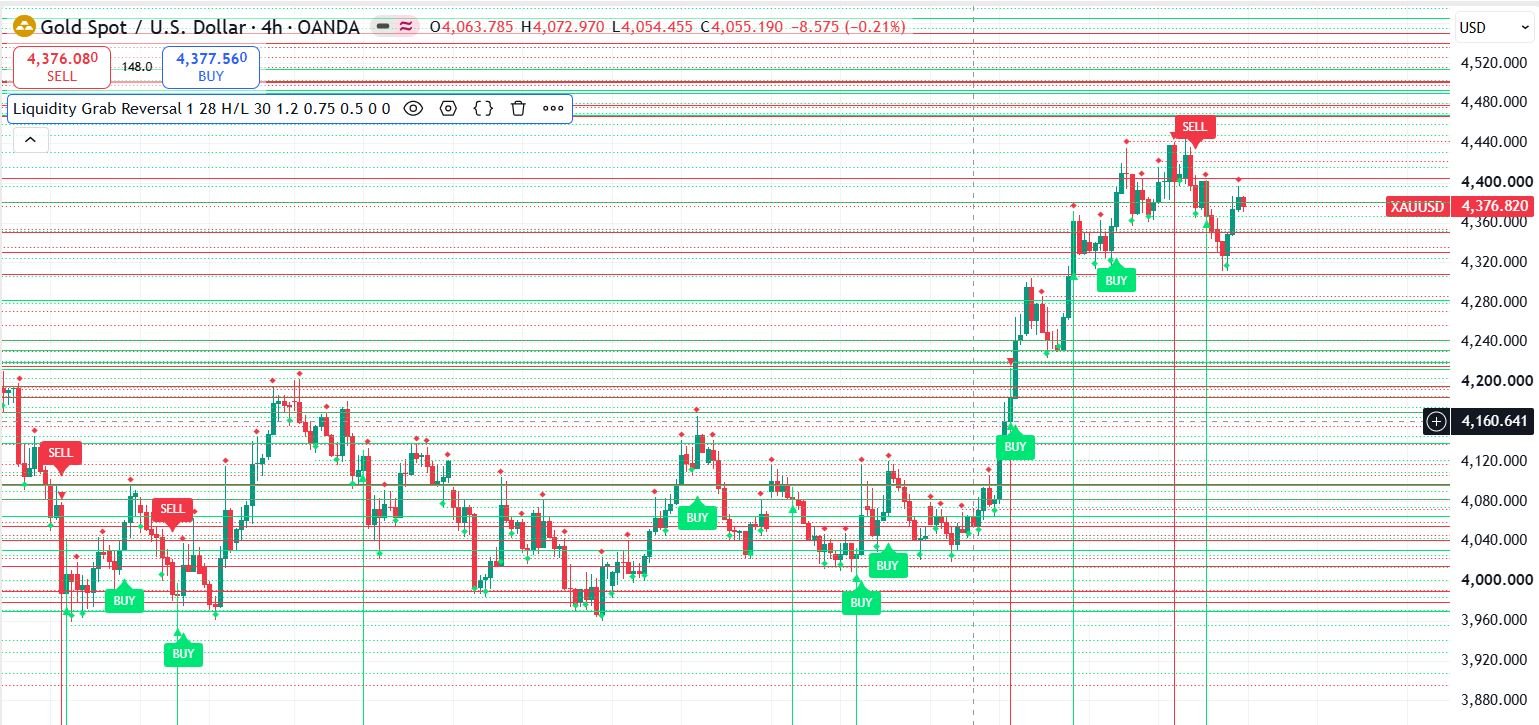
Pine Script to MT4/MT5 Conversion Planner
Analyze Pine strategies, repainting risk, TradingView alert bridges, MTF synchronization and the correct MQL4/MQL5 build path before paying for conversion.
Open planner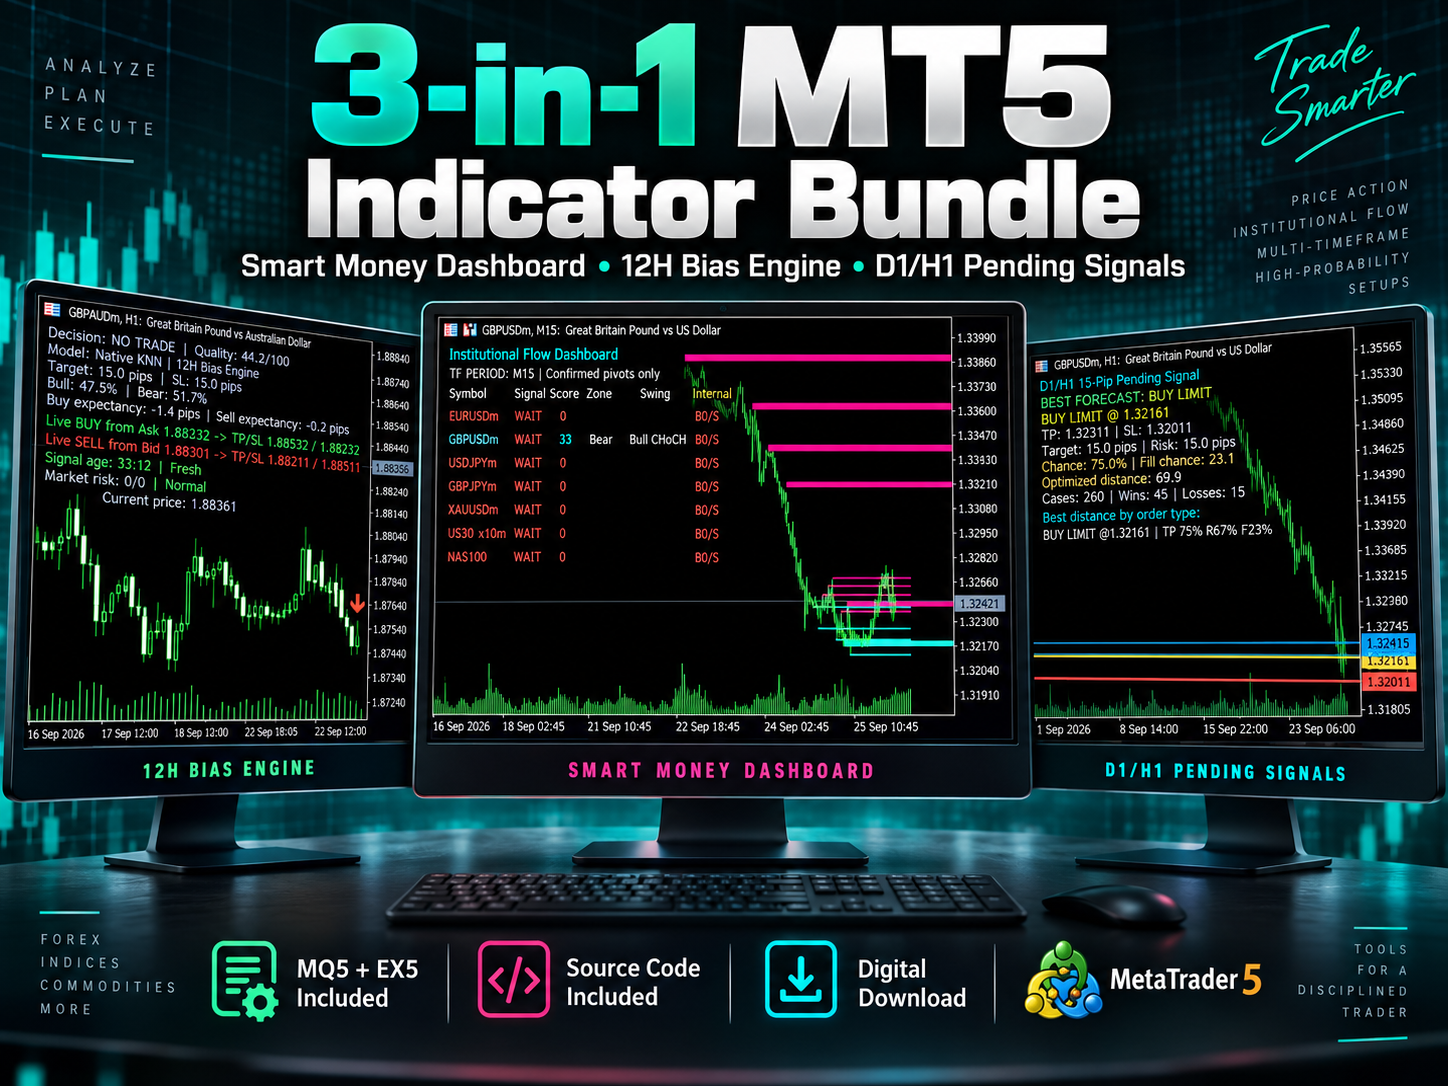
3-in-1 MT5 Indicator Bundle
12H Bias Engine, Smart Money Institutional Flow Dashboard and D1/H1 pending-signal logic with MQ5 + EX5 source included via Etsy.
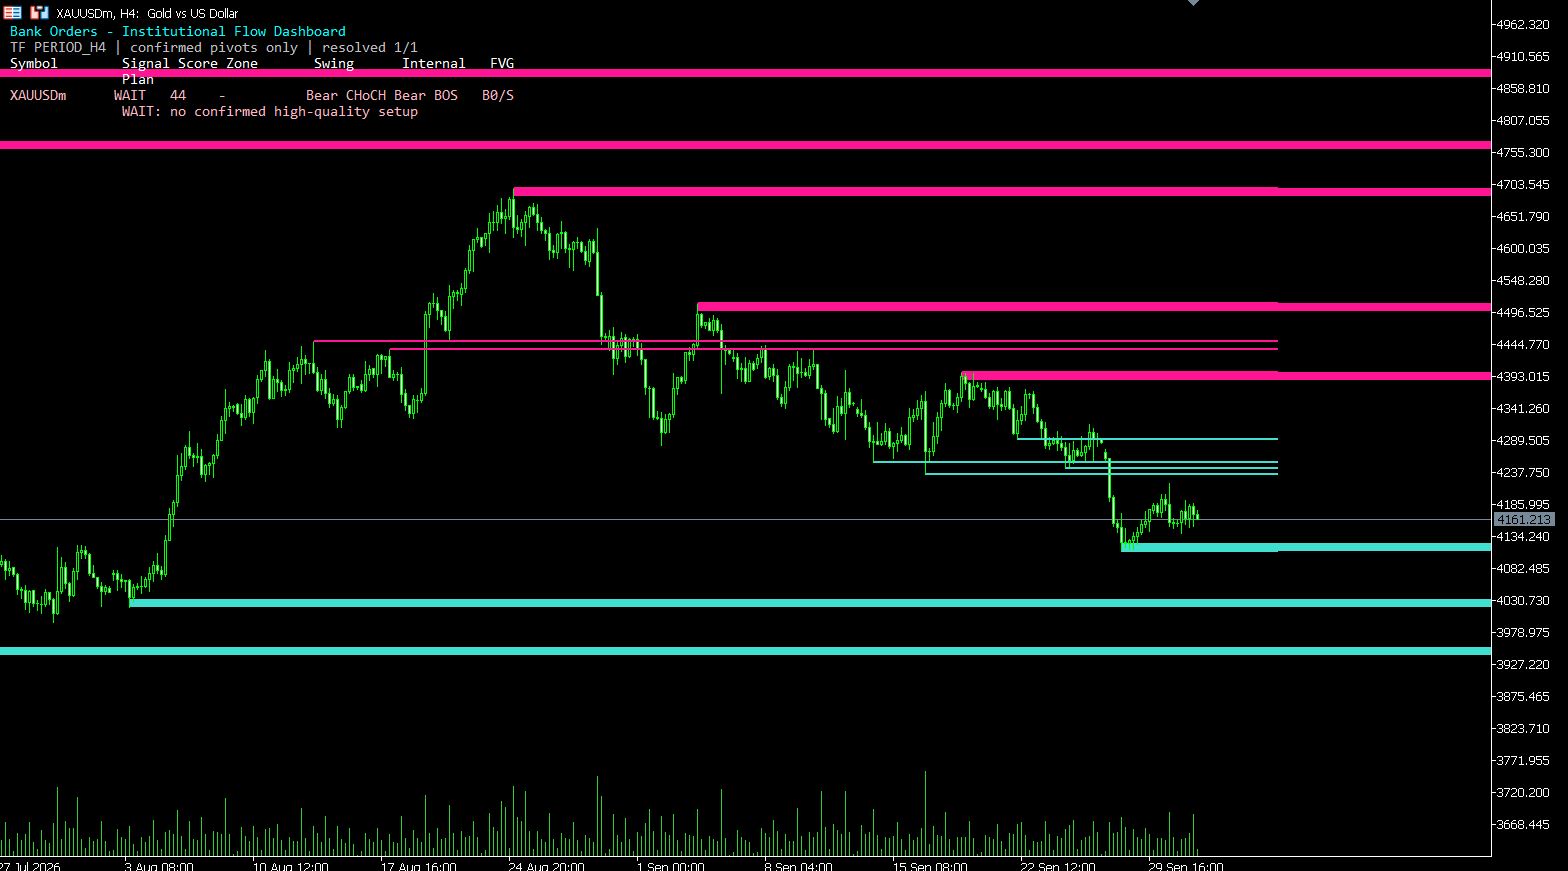
MT5 Bank Orders Institutional Flow Dashboard
Supply/demand zones, BOS/CHoCH, liquidity levels, FVG, equal highs/lows and confirmed trade-plan logic explained with EX5 download.
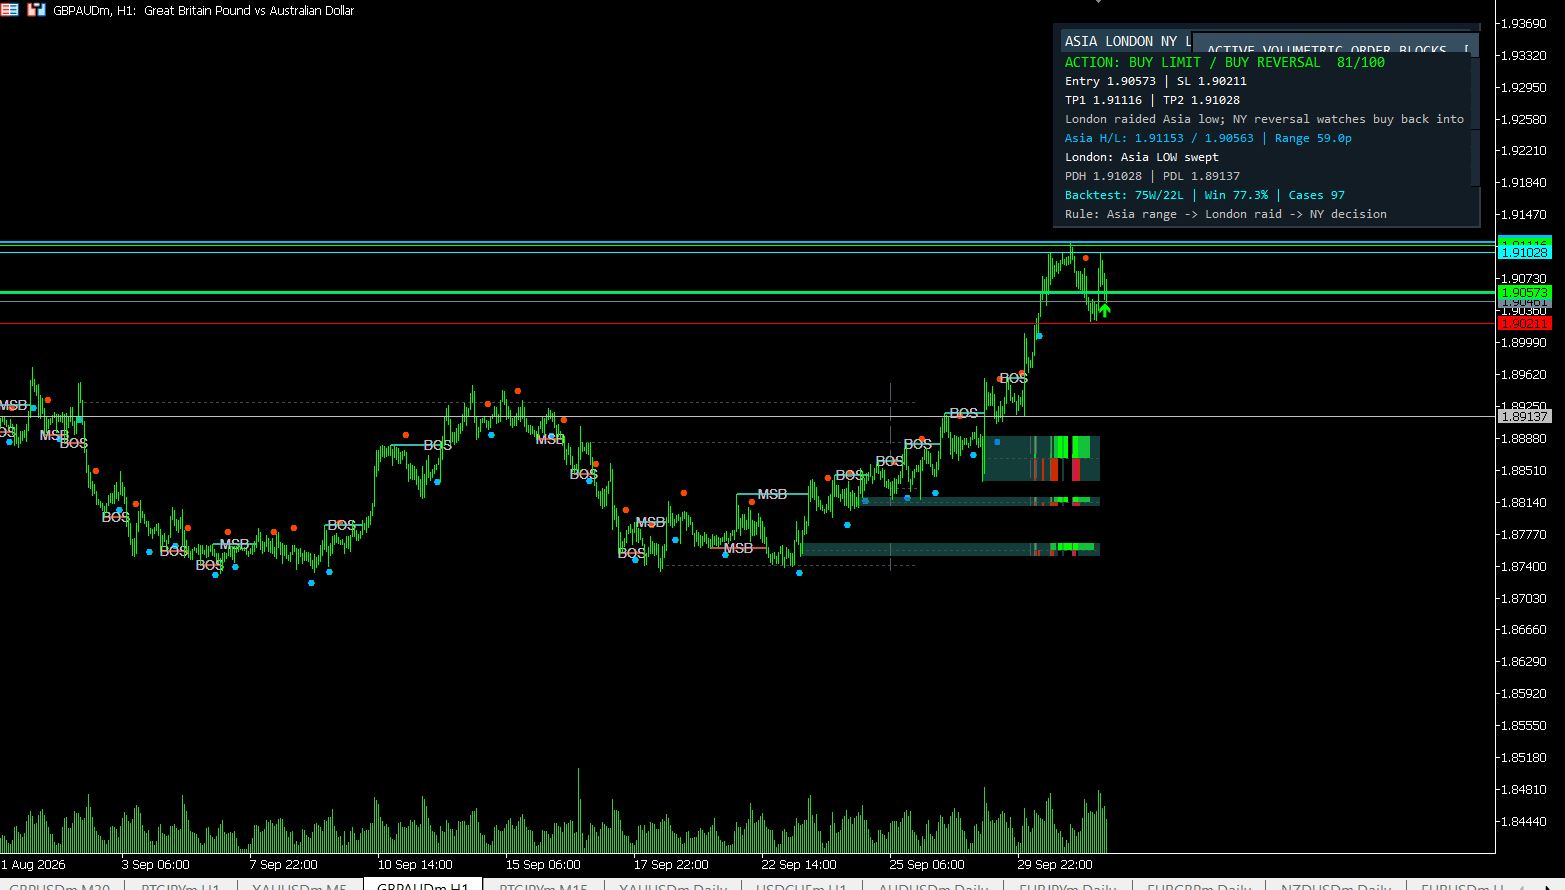
MT5 Asia London NY Liquidity Engine
Asia range, London raid and New York continuation/reversal planning with internal session backtest stats and entry/SL/TP dashboard.
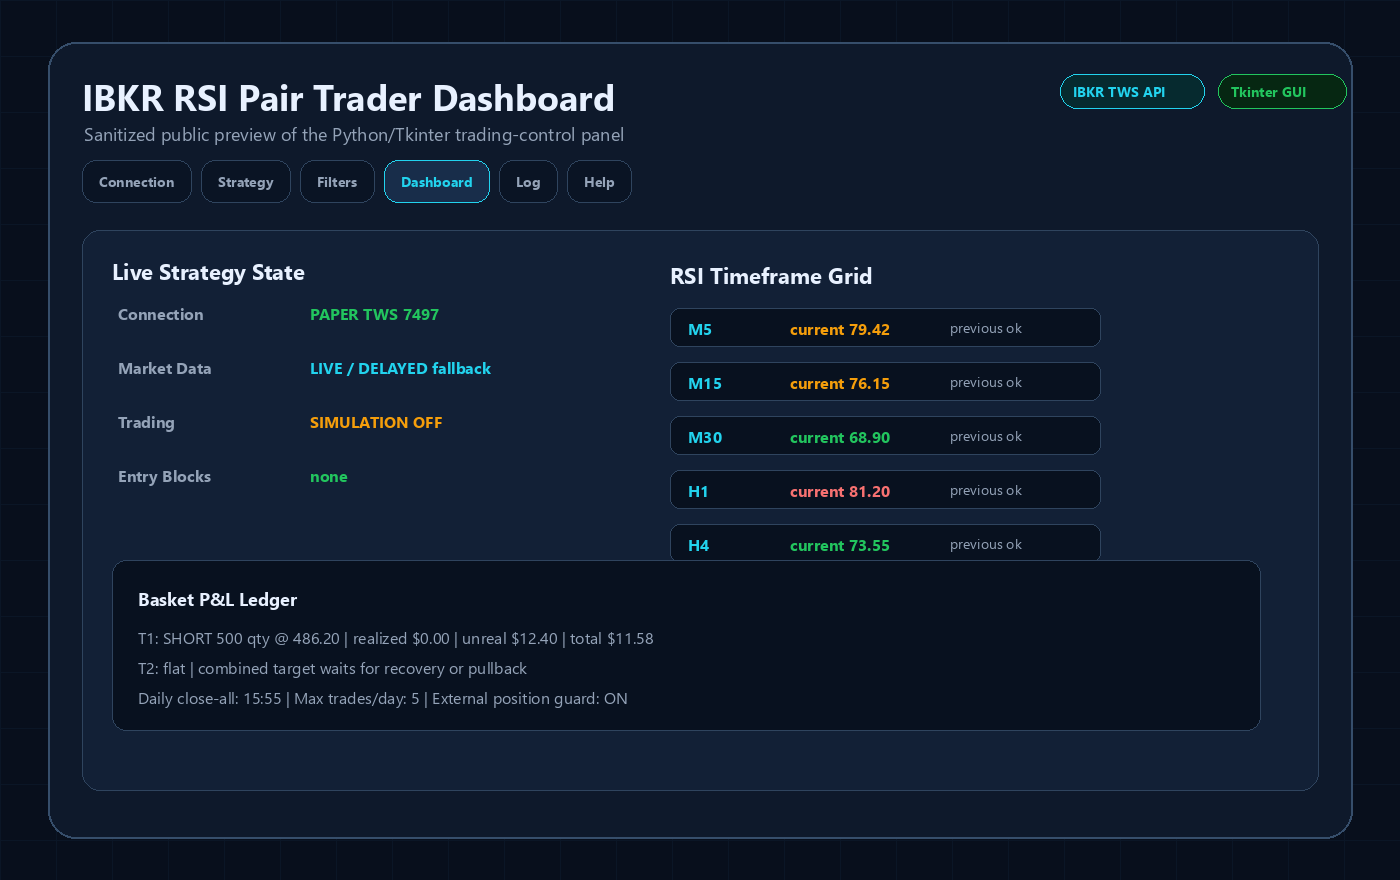
Interactive Brokers RSI Pair Trader
Tkinter desktop trading workflow, TWS API connection handling, RSI pair logic, risk controls and custom IBKR development positioning.
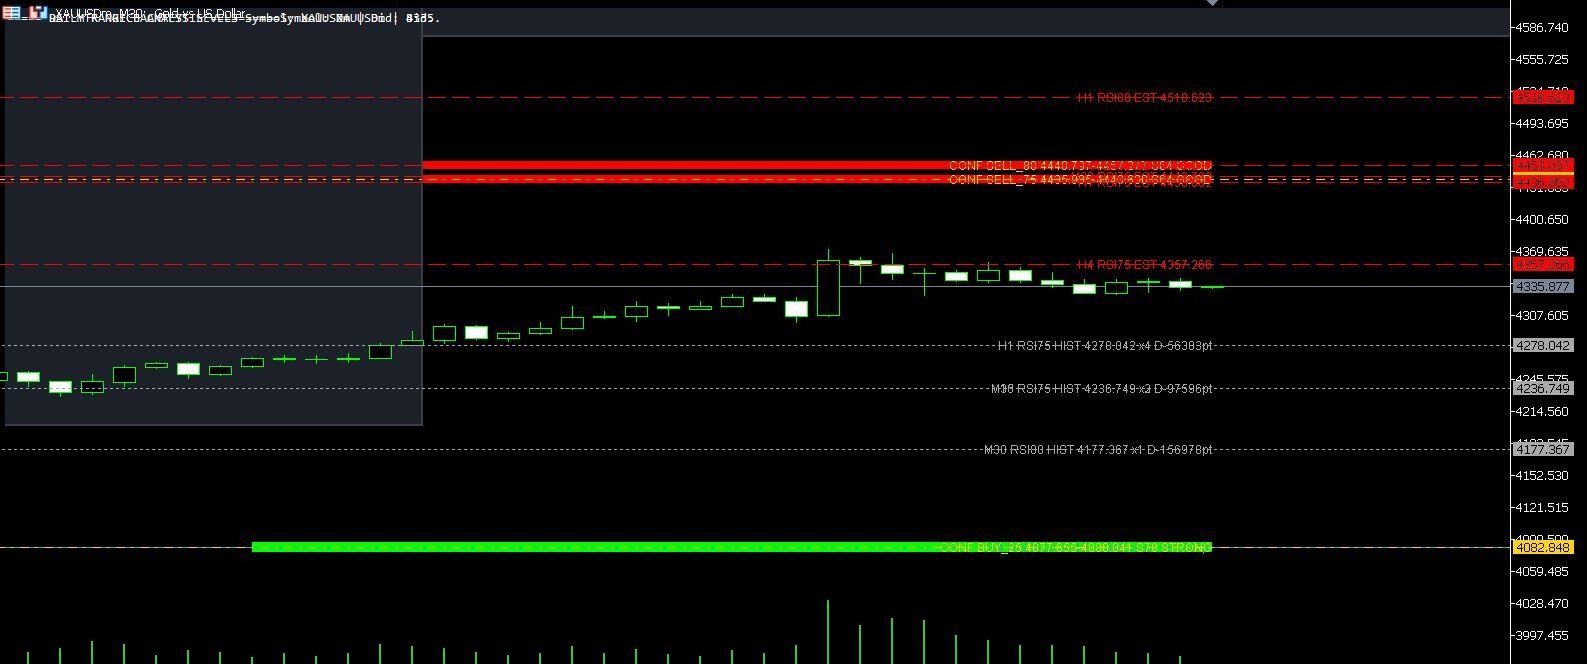
XAUUSD M30 CSV Data For Backtesting
Use clean MT5 historical data for Python backtests, strategy validation, spread checks and realistic gold EA research workflows.