SMC Code Map
Understand how an SMC indicator is assembled before changing it. This map groups the engine into data, structure, drawing, alerts and rendering layers, with the order in which each layer depends on the next.
Try the tool
Runs locally in your browser. No uploads, no API keys.How to use it
- Start with OHLC series and ATR.
- Build swings and structure.
- Derive order blocks, FVG and zones.
- Render objects and fire alerts.
SMC Code Map FAQ
Is this a function-by-function source map?
It is a conceptual architecture map, not a copy of any project source.
Why separate state from rendering?
It makes real-time updates and repaint checks easier to reason about.
Can I use this for an EA?
Yes, as a planning map for the signal and risk layers.
Related SMC tools
These tools are educational calculators. They do not provide trading signals, execute orders or guarantee results. Validate any output independently.
Turn the calculation into an EA
If the tool exposed a profitable or risky condition, convert it into a coded rule with testing and guardrails.
Go deeper before you build, download or automate
Hand-picked engineering articles, indicator breakdowns and trading-system tools so visitors keep exploring instead of leaving after one page.
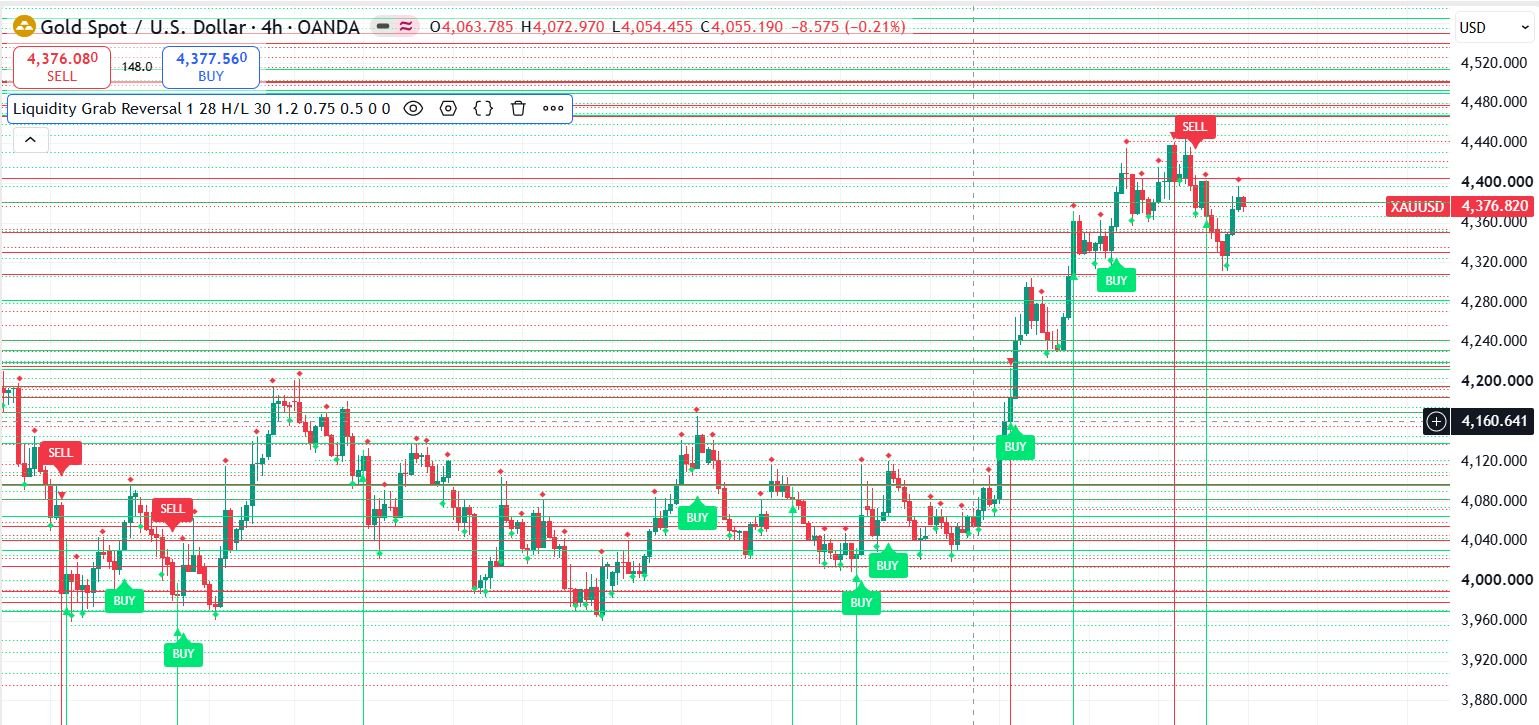
Pine Script to MT4/MT5 Conversion Planner
Analyze Pine strategies, repainting risk, TradingView alert bridges, MTF synchronization and the correct MQL4/MQL5 build path before paying for conversion.
Open planner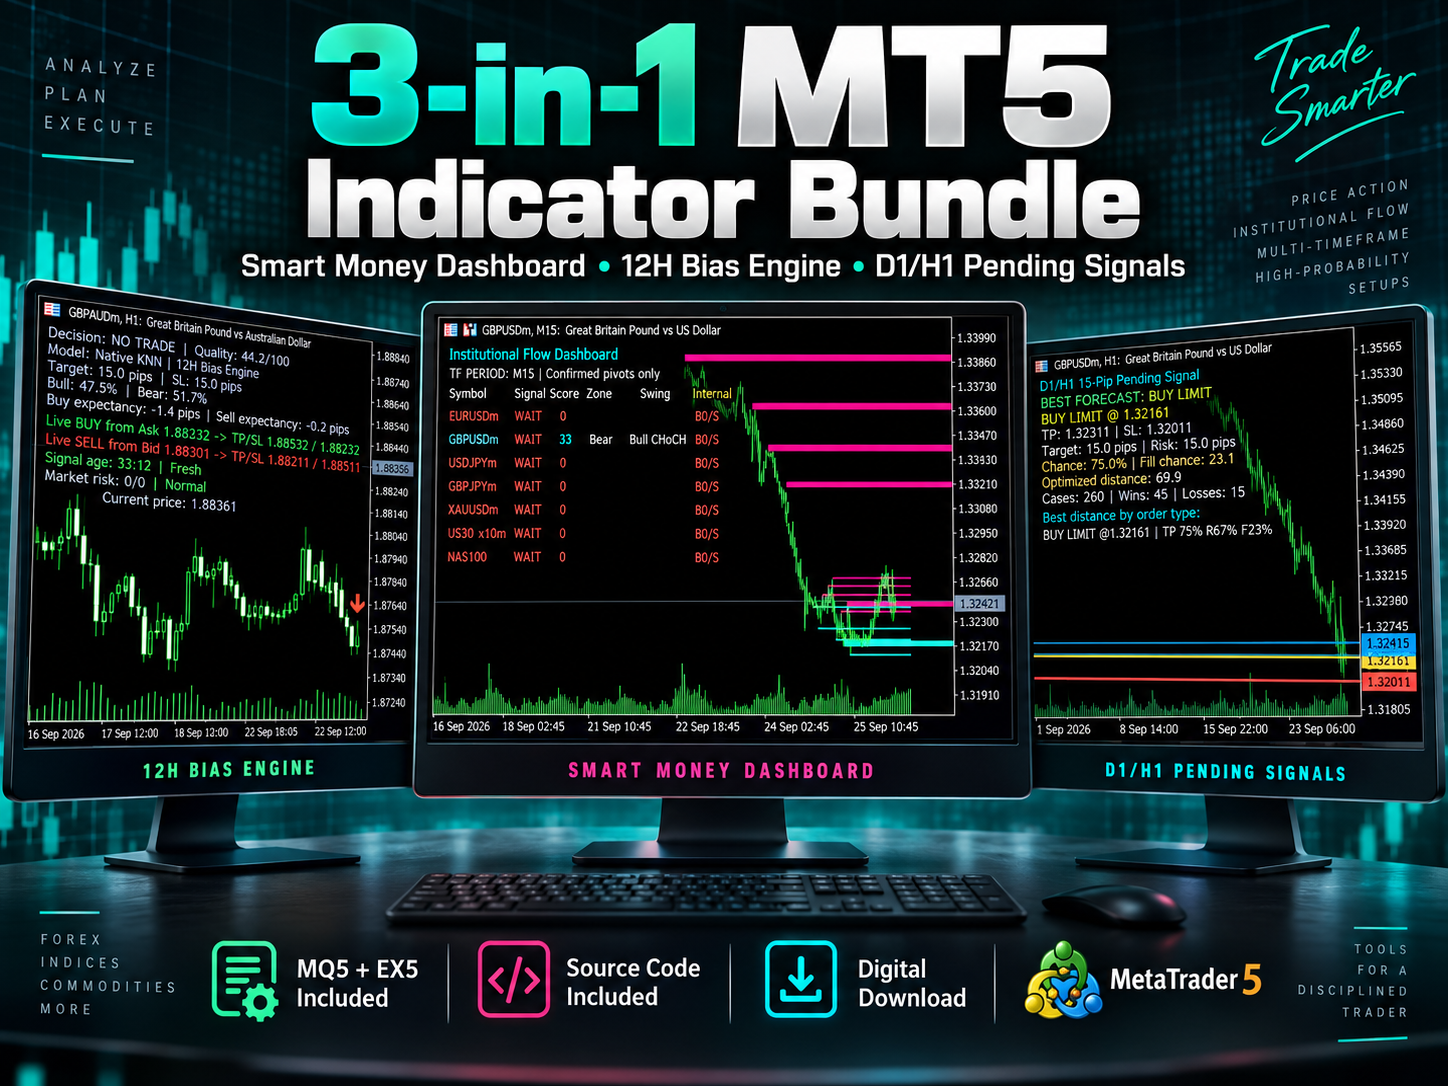
3-in-1 MT5 Indicator Bundle
12H Bias Engine, Smart Money Institutional Flow Dashboard and D1/H1 pending-signal logic with MQ5 + EX5 source included via Etsy.
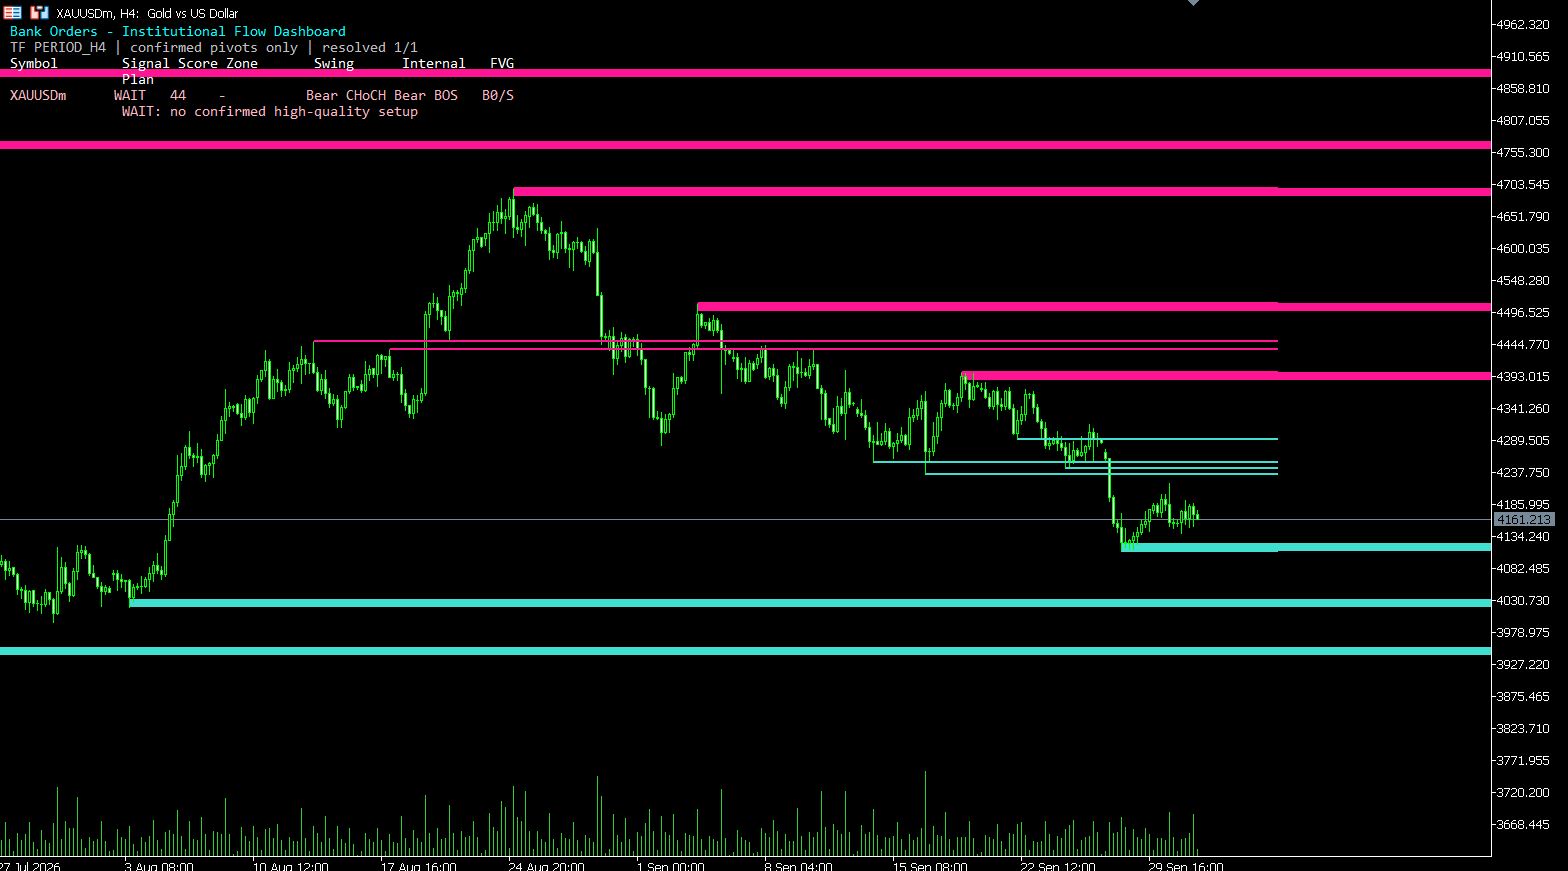
MT5 Bank Orders Institutional Flow Dashboard
Supply/demand zones, BOS/CHoCH, liquidity levels, FVG, equal highs/lows and confirmed trade-plan logic explained with EX5 download.
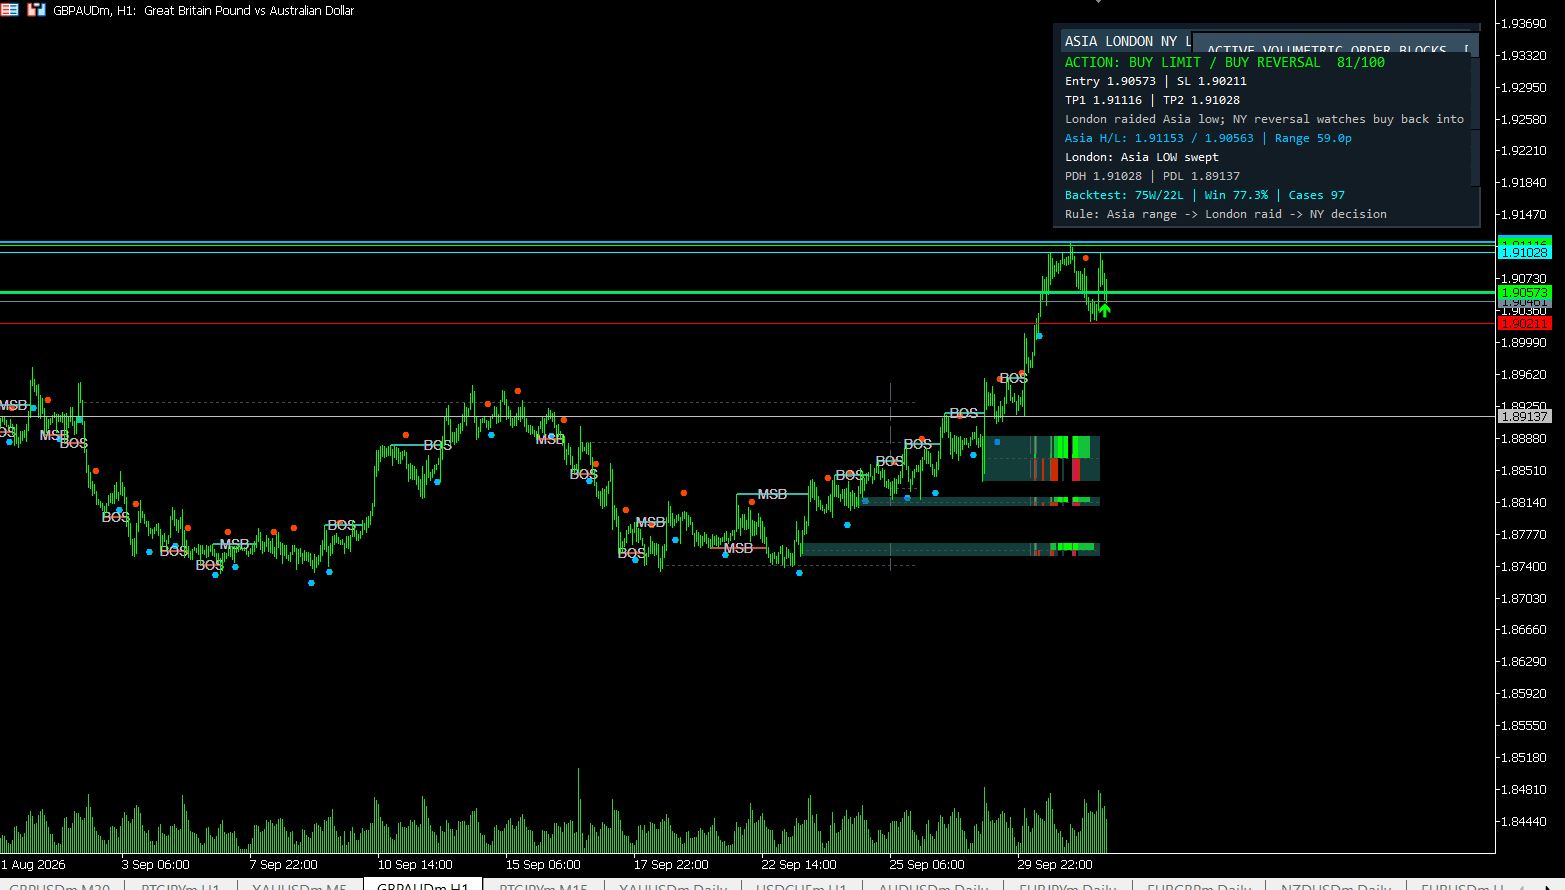
MT5 Asia London NY Liquidity Engine
Asia range, London raid and New York continuation/reversal planning with internal session backtest stats and entry/SL/TP dashboard.
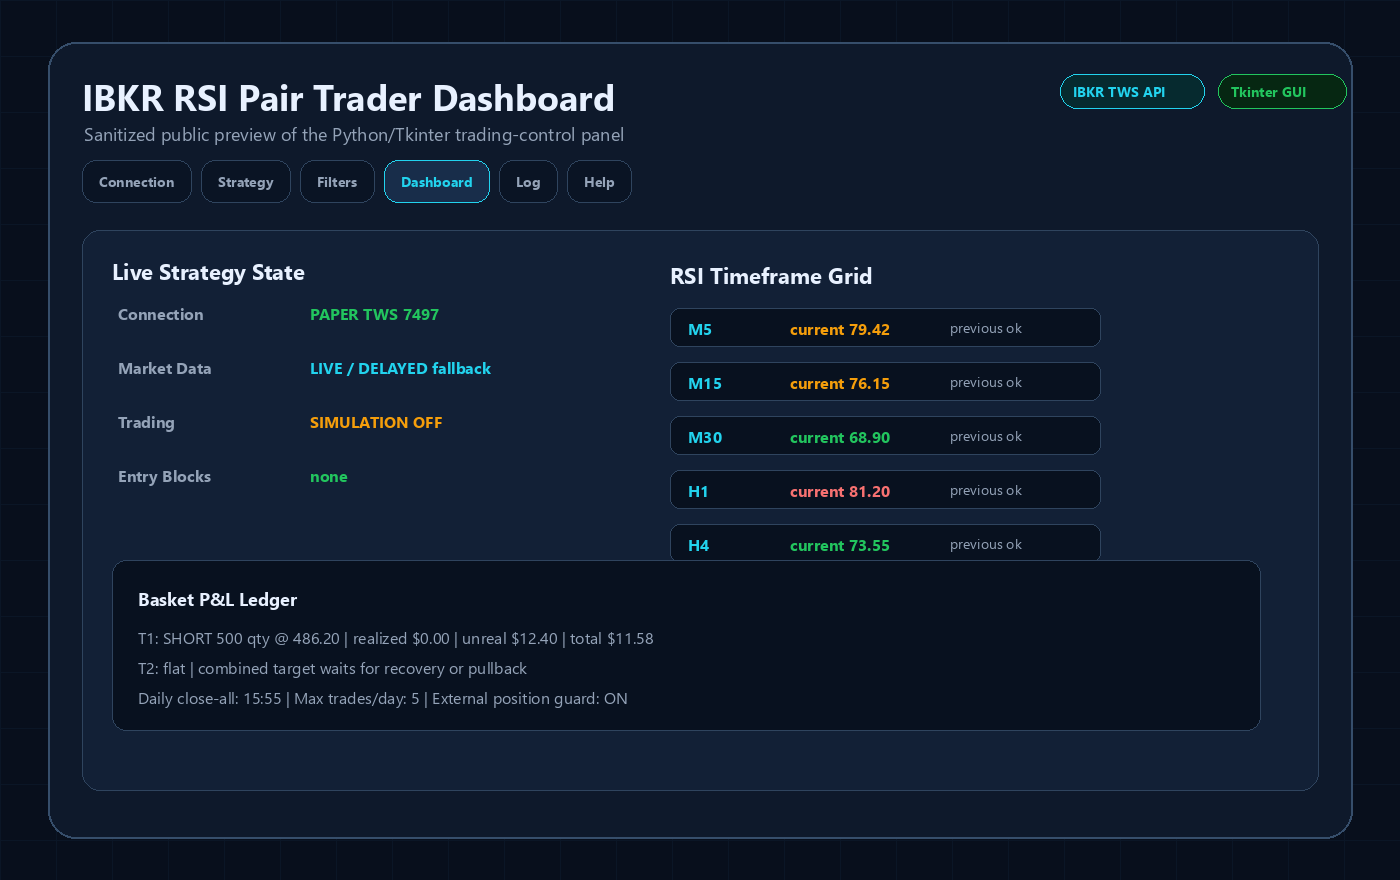
Interactive Brokers RSI Pair Trader
Tkinter desktop trading workflow, TWS API connection handling, RSI pair logic, risk controls and custom IBKR development positioning.
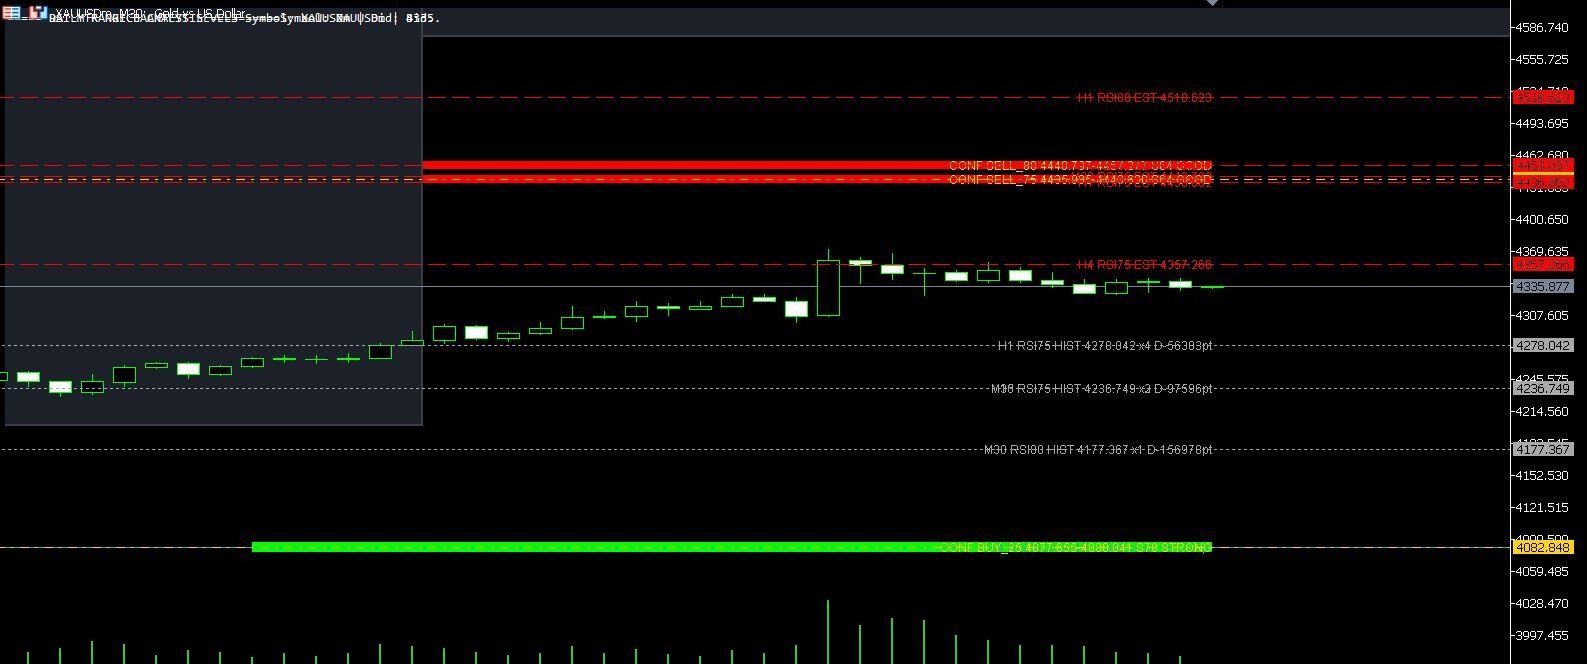
XAUUSD M30 CSV Data For Backtesting
Use clean MT5 historical data for Python backtests, strategy validation, spread checks and realistic gold EA research workflows.